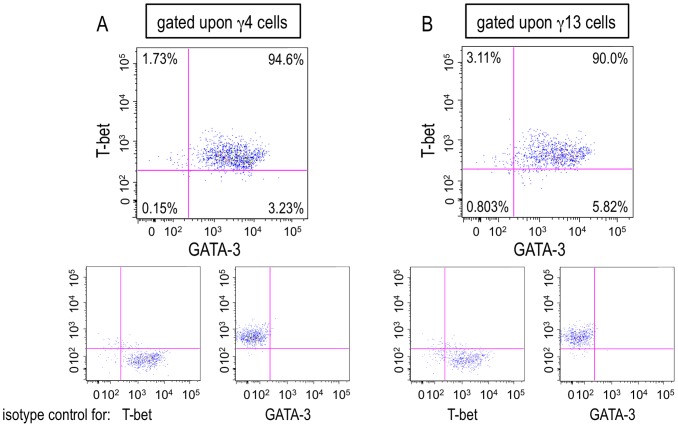
Figure 8. Both T-bet and GATA-3 were expressed in a single hepatic γ4 or γ13 cell.
(A and B) Hepatic lymphocytes were isolated from S. mansoni-infected mice and the expressions of T-bet and GAT-3 were analyzed by flowcytometry after TCR stimulation at 6 weeks PI. The numbers in the upper, large insets represent percentages of each population divided by the expressions of T-bet and GATA-3 in γ4 (A) or γ13 (B) cells. The lower, small insets represent the data using isotype control antibodies. Similar results were obtained in three independent experiments.

