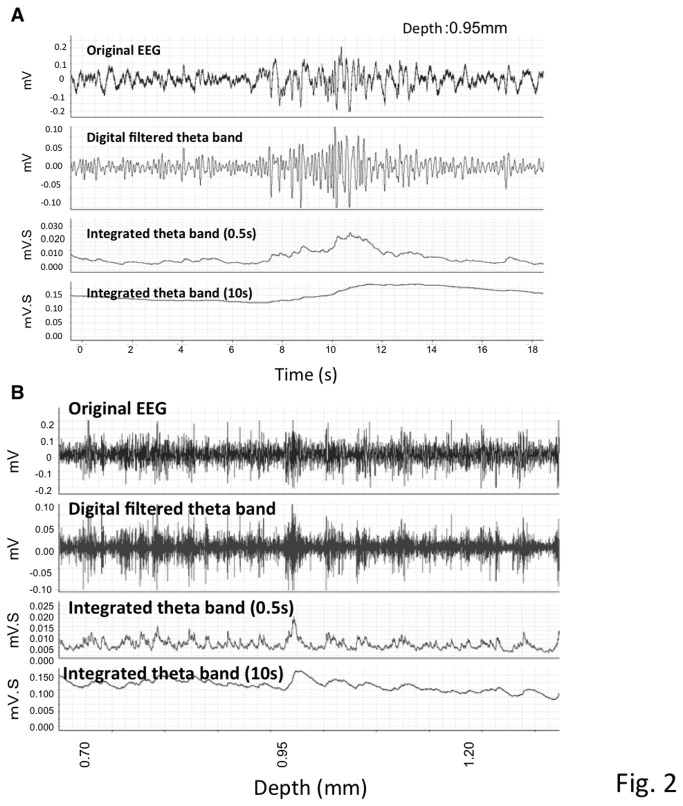
Figure 2. Representative EEG data.
A. Raw EEG data collected from a recording electrode (top) and filtered EEG after selecting for theta oscillations (4-8 Hz) (middle). An isolated theta oscillation in a 10 sec and 20 sec bin was analyzed using integrated values (0.5 sec and 10 sec durations) at a depth of 0.95mm from the cortex.
B. Sequential recording of EEG at different depths. The same three types of data are presented as in Figure 2A with changes at different depths indicated at the bottom. Twenty seconds of recording data at each depth were collected, analyzed, and integrated over 0.5 sec and 10 sec.

