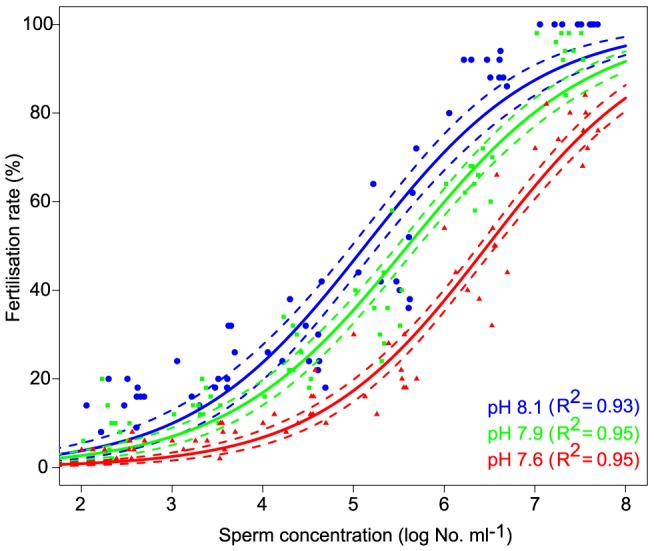
Figure 1. Fertilisation success of A. planci oocytes across a range of sperm concentrations (102–108 sperm ml−1) under three pH/pCO2 conditions.

Solid lines represent best-fit curves under three different pH/pCO2 scenarios, and corresponding dashed lines are 95% confidence intervals.
