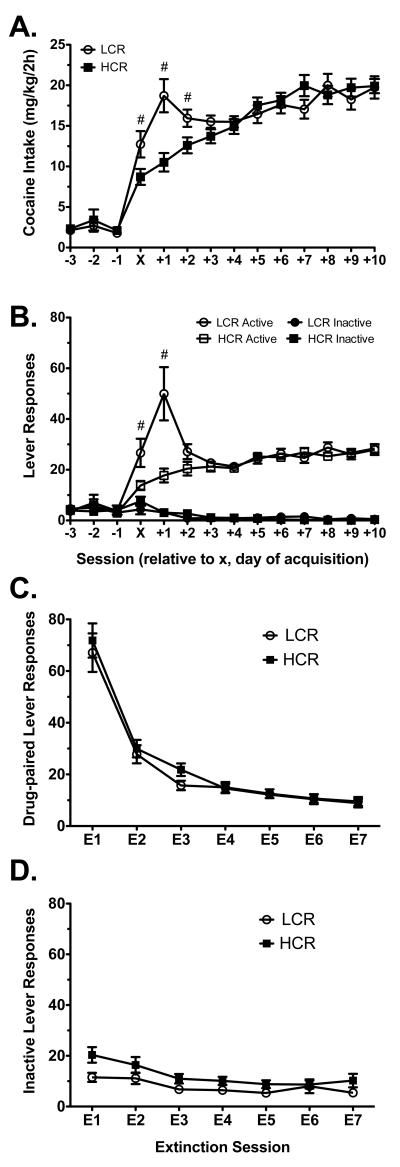
Figure 1.
Acquisition and extinction of cocaine self-administration in LCRs (n = 25) and HCRs (n = 25). Cocaine intake (A) and lever responding (B) are shown over the 3 sessions prior to, day of, and 10 post-acquisition sessions (session x). Responses on the drug-paired (C) and inactive (D) levers are shown for the 7 extinction sessions prior to reinstatement testing. Data are mean values ± SEM. White circles = LCRs, solid black squares = HCRs. #p < 0.05 LCRs vs. HCRs.

