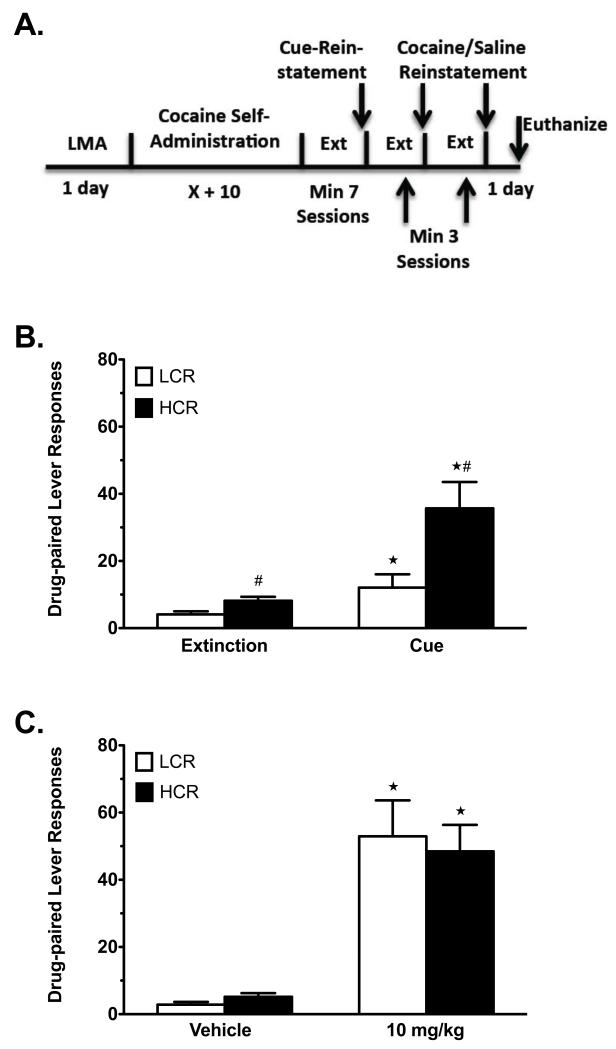
Figure 2.
Reinstatement testing in LCRs and HCRs in Group SA1. A) Timeline of reinstatement testing for LCRs and HCRs. B) Cue-primed reinstatement of cocaine seeking (LCRs n = 12, HCRs n = 12). C) Cocaine-primed reinstatement of cocaine seeking (LCRs n = 12, HCRs n = 11). Data are mean values ± SEM. White bars = LCRs, solid black bars = HCRs. #p < 0.05, LCRs vs. HCRs. *p < 0.05, test (cue or 10 mg/kg cocaine) vs. baseline (extinction or vehicle).

