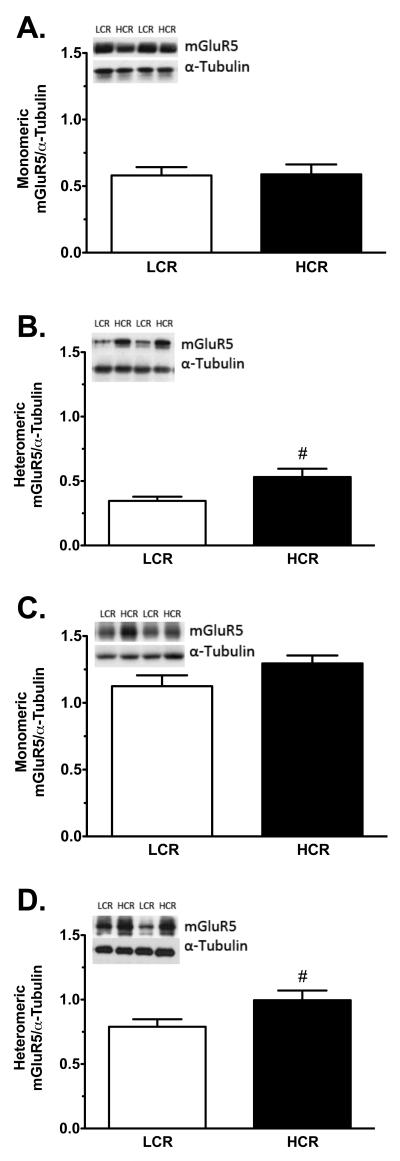
Figure 4.
Western blot analysis of dSTR mGluR5 levels in LCRs and HCRs. Representative western blots and monomeric and heteromeric mGluR5 levels are shown for groups SA1 (A and B, respectively; LCRs n = 12, HCRs n = 12) and SA2 (C and D, respectively; LCRs n = 13, HCRs n = 13). Values are the ratio of mGluR protein immunoreactivity to α-tubulin loading control immunoreactivity. Data are mean values ± SEM. White bars = LCRs, solid black bars = HCRs. #p < 0.05, LCRs vs. HCRs.

