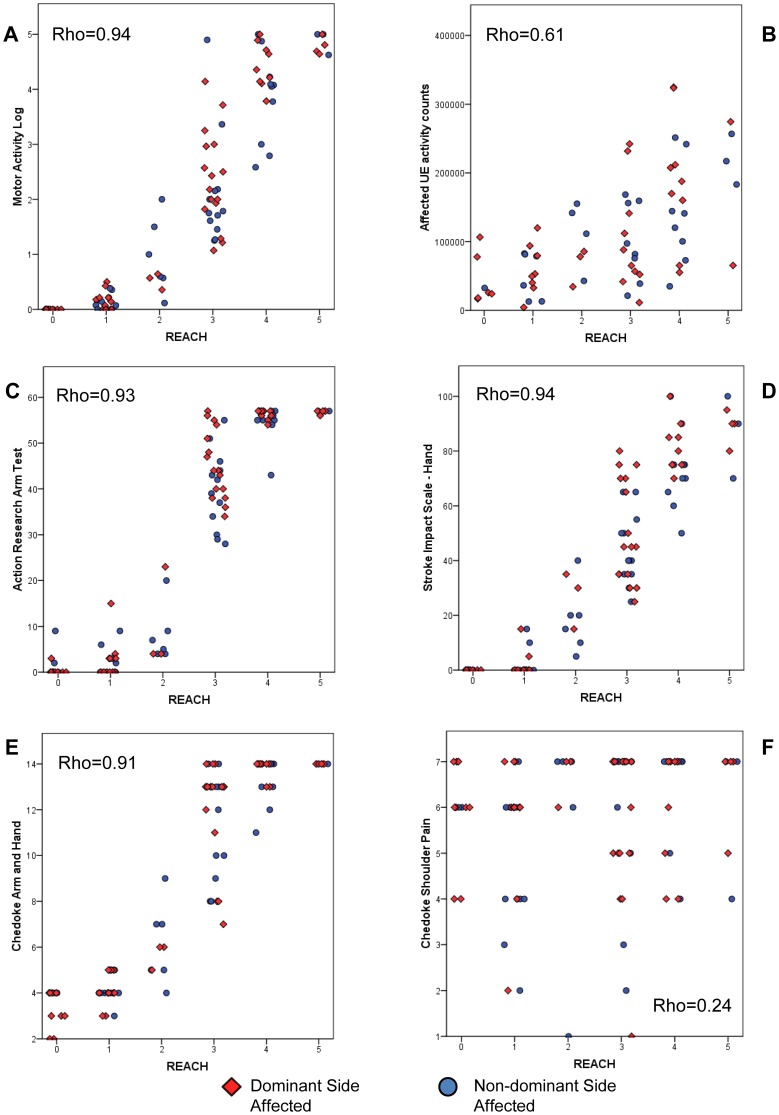
Figure 6. Scatterplots of REACH scale scores with external measures of upper extremity (UE) use, function and impairment.
Plots A, B show relationship between REACH scores and measures of UE use. Plots C, D show relationship between REACH scores and measures of UE function. Plots E, F show relationship between REACH scores and measures of UE impairment. The plots include a horizontal jitter to ensure visibility of data points at identical locations.

