
Figure 3. Analysis of fibrosis.
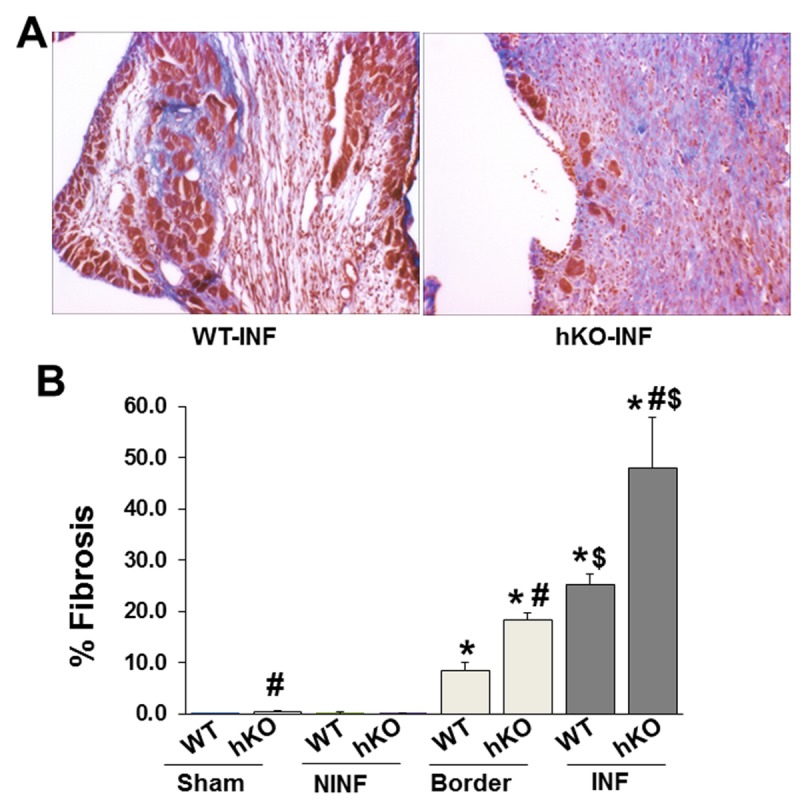
Masson’s trichrome stained sections of the heart were used for quantitative measurement of fibrosis. A. Masson’s trichrome-stained sections demonstrating fibrosis in WT and hKO mice 7 days post-MI. B. Quantitative analysis of fibrosis. NINF, non-infarct LV region; INF, infarct; *p<0.05 vs sham; #p<0.05 comparisons between WT and hKO groups; $p<0.05 vs border; n=6-7.