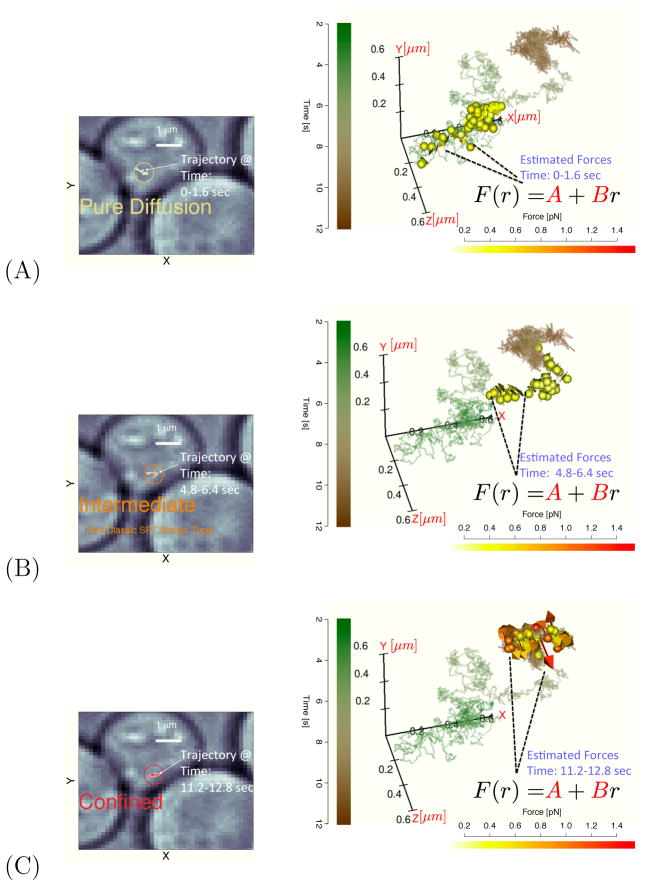
Figure 1.
The left column panels display 2D segments of a single mRNA trajectory for three different time windows. The right panels repeatedly plot the full 3D trajectory as a solid line (time color coded); in each panel, the inferred force vectors corresponding to the time segments shown the 2D panel to the left are plotted (force magnitude color code shown in scale bar). These forces were obtained by first estimating the SDE parameters in the window and then using the measurements to evaluate the force at several “micro-times” in the local time window. Panel (A) corresponds to the force estimated in window 1 (this panel also shows the time legend used for all plots as well as the white light cell image). This panel would be typically labeled as a “pure diffusion” as the force vectors estimated are very small; Panel (B) corresponds to time window 4 where there is a transient regime that would not fall into any classical single particle tracking motion type. Panel (C) plots time window 8 data which would be considered as “confined”. The inferred force vectors can be estimated from the observed time series without using an external force probe; the magnitude and direction of the forces arrows help identify the inward facing forces experienced by the confined particle. All 3D images were produced using the RGL package65.

