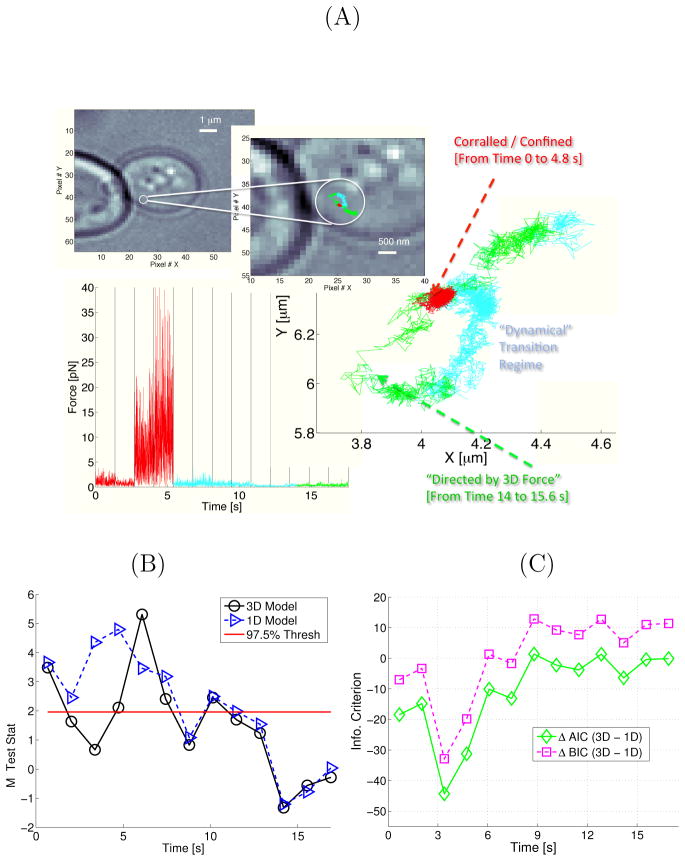
Figure 3.
A case where the particle interacts with an object in the cytoplasm. Panel A shows the location in the cell where the image was taken. The microscope images is magnified and the x–y coordinates of the experimentally measured trajectory is shown in color. The red region shows where the particle was confined by large constraint forces. The inferred forces reached magnitudes as high as 30pN for long time bursts (Fig. S7 illustrates that this force burst was insensitive to W); the cyan region is a dynamical regime encountered before the particle experiences a “3D directed force” (a regime denoted by green and discussed in the text). Panel B plots the goodness-of-fit test statistic and Panel C plots the AIC and BIC comparing a genuine 3D model to a 1D model (lower values indicate better fits for both goodness-of-fit and model selection statistics). The trajectory strongly suggests constraint forces and the AIC and BIC model selection criteria verified that adding correlation between the effective forces governing the particle dynamics improves the fit. The experimental trajectory and effective forces imply the existence of a manifold on which the particle evolves. The SDE quantifies the strength of the “tether” to this manifold.

