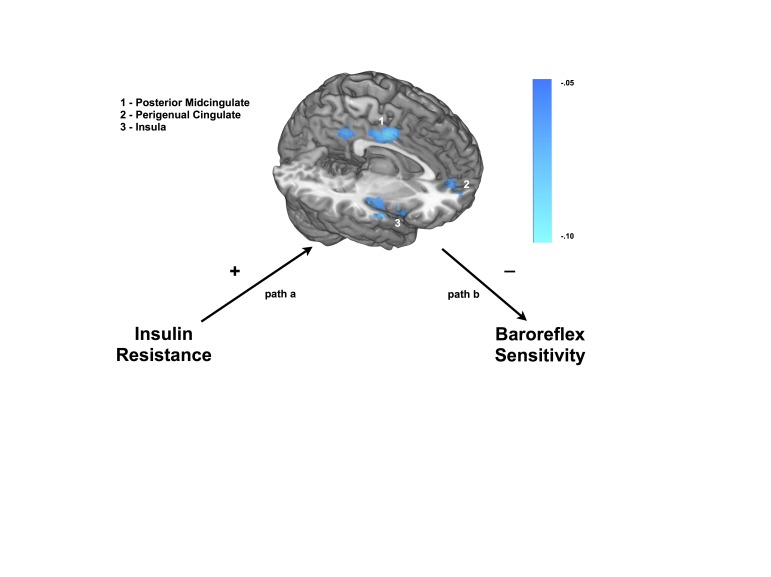
Figure 1. Regions that statistically mediated the relationship between insulin resistance (IR) and baroreflex sensitivity (BRS).
Results presented are ‘path a*b’ regression coefficient output from the BRAVO mediation toolbox. Regions displayed statistically mediated the relationship between IR and BRS after covarying for resting systolic blood pressure, age, sex, waist circumference and global cerebral bloodflow. To correct for multiple comparisons, a cluster threshold was utilized (p-uncorrected = .005, k = 109) to maintain a whole brain threshold of p < .05.

