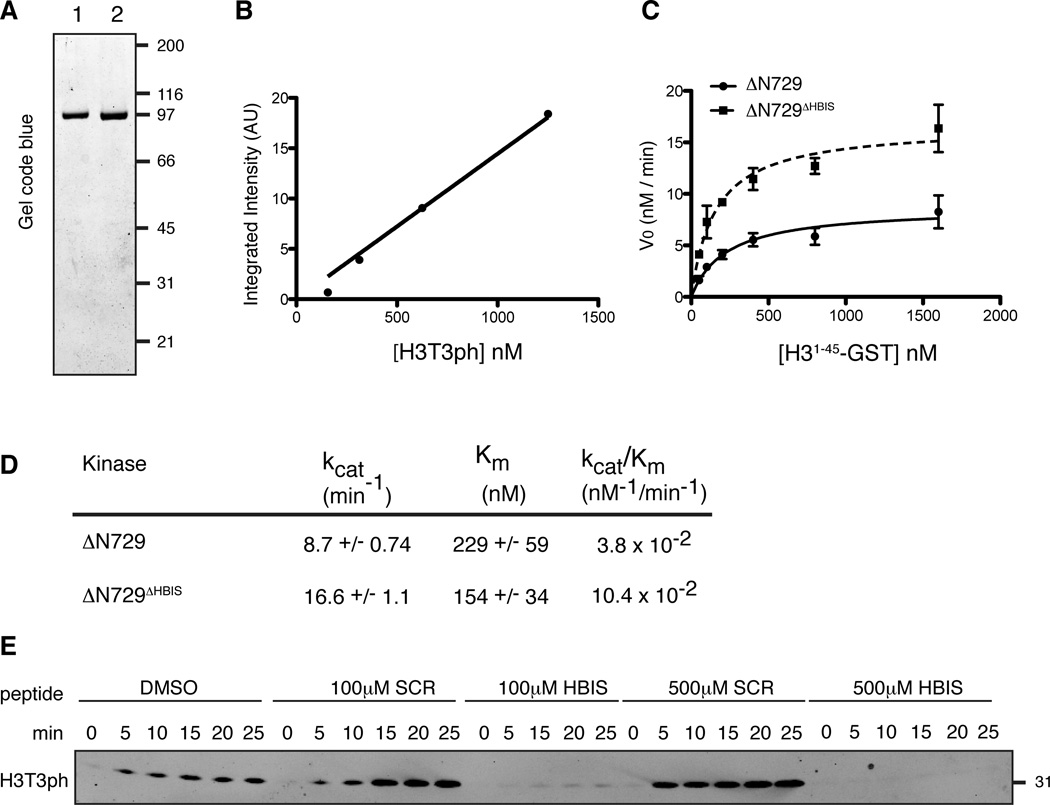
Figure 4. The HBIS directly inhibits xHaspin.
(A) Gel code blue staining of purified MBP-xHaspin-ΔN729 (1) and MBP-xHaspin-ΔN729ΔHBIS (2).
(B) Signal intensity of Western blots using the anti-H3T3ph antibody (A.U.) was plotted against the amount of H3T3ph (loaded). The signal intensity showed a linear relationship to the input H3T3ph.
(C) Initial velocities of H3T3 phosphorylation reaction using 1 nM MBP-xHaspin-ΔN729 or MBP-xHaspin-ΔN729ΔHBIS at various H31–45-GST concentration are shown. Triplicate data sets were fit to the Michaelis-Menten equation using the nonlinear least square fit method. Error bars represent standard error of the mean.
(D) Km and kcat values were obtained after fitting the data in C to the Michaelis-Menten equation.
(E) Either HBIS- or SCR-peptides were added at the indicated concentration to the in vitro kinase reaction with 1 nM xHaspin-ΔN729 and 200 nM H31–45-GST. Substrate phosphorylation was detected by Western blots using anti-H3T3ph antibody.
See also Figure S4.

