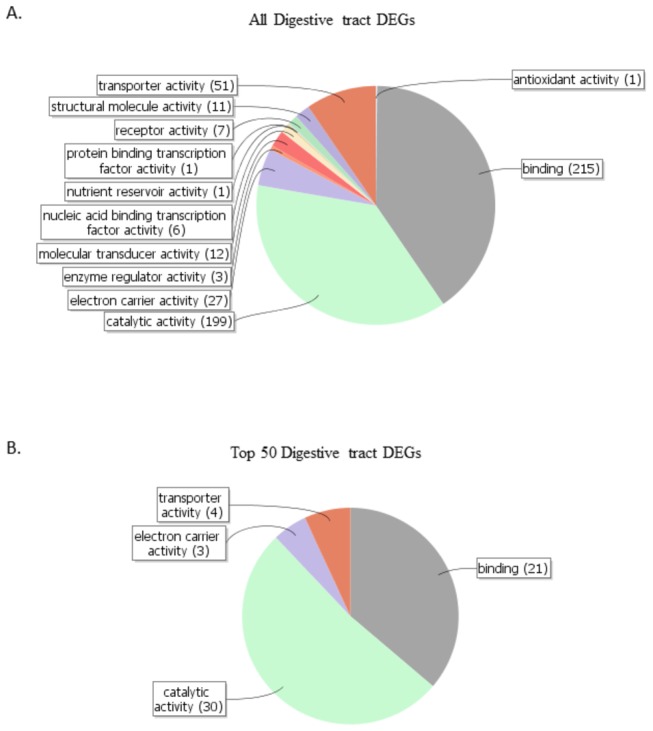
Figure 5. Gene ontology analysis of differentially expressed genes between nurse and forager digestive tracts.

Top panel shows the distribution of GO functional categories for all DEGs found (565 in total), while the bottom panel shows the same for the genes with the 50 highest probabilities of being differentially expressed (the 50 genes with the most robust patterns of differential expression).
