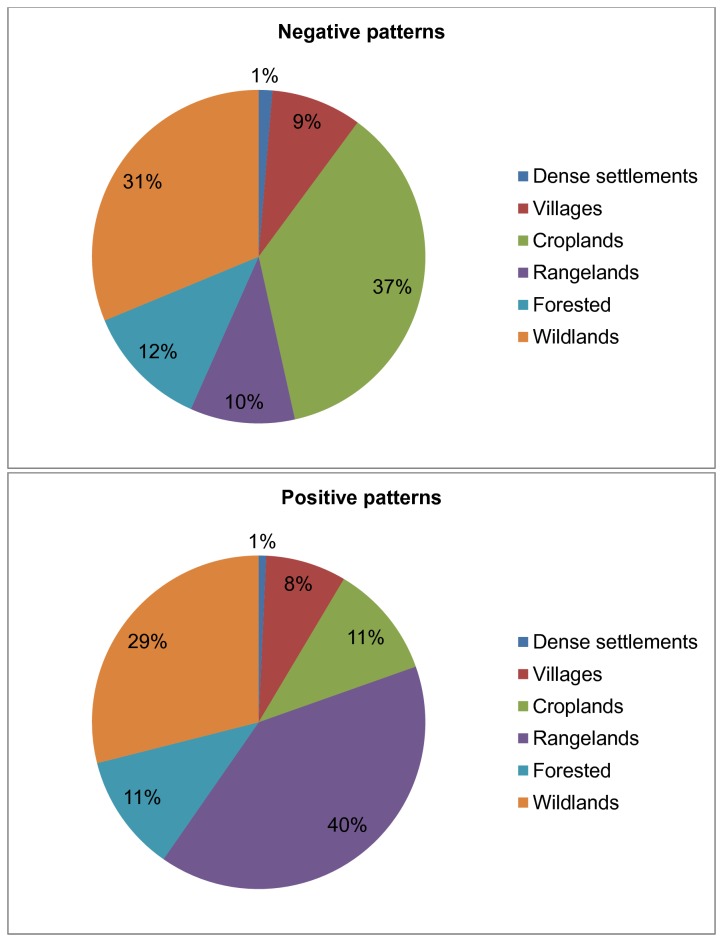
Figure 3. Proportion of Anthromes showing negative and positive relationship.
Pie-charts showing the relative proportion of the total area showing (A) positive and (B) negative significant relationships between burned area and population density, classified according to the six major anthrome types defined by Ellis and Ramankutty (2008).

