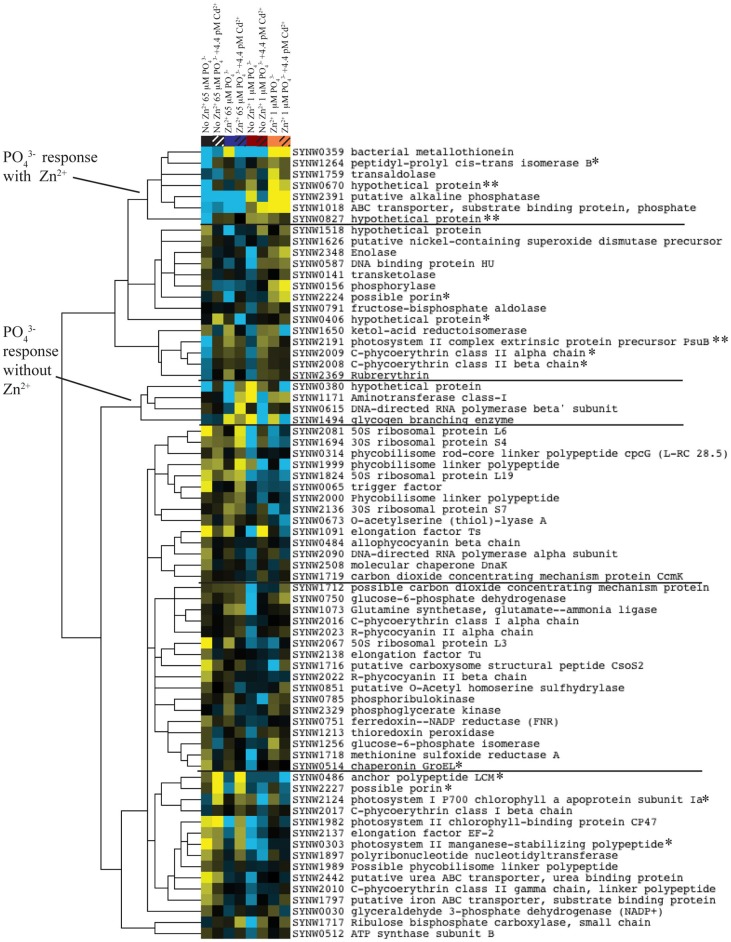
Figure 4.
Cluster analysis of relative protein abundances. no Zn/65 μM PO43−, Zn/65 μM PO43−, no Zn/1 μM PO43−, Zn/1 μM PO43− and these four chronic treatments with short term 4.4 pM Cd2+ added. The four low PO43− treatments are on the right and replete, and high PO43− on the left. There are 71 proteins. Protein relative abundances are averages of duplicates, have at least 7 counts, and are different by a value of 7. Data are log transformed, centered, and clustered by Kendall's Tau, centroid linkage. Yellow, more abundant; Blue, less abundant; *, statistically different by Fisher's Exact Test between the no Zn/high PO43− and the no Zn/high PO43−/short-term Cd; **, differentially abundant by two-fold or greater and statistically different by Fisher's Exact Test between the no Zn/high PO43− and the no Zn/high PO43−/short-term Cd.

