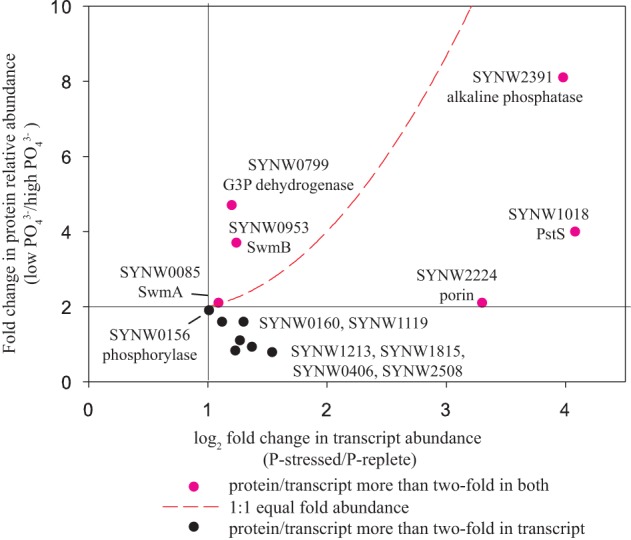
Figure 6.

Fold change in protein relative abundance (this experiment) as ratio of low phosphate to high phosphate vs. log2 fold change in gene relative abundance (Tetu et al., 2009) as ratio of P-stressed to P-replete. Pink dots represent proteins/transcripts more than two-fold abundant in both protein and transcript data. Black dots represent proteins/transcripts more than two-fold abundant in transcript data. Red dashed line indicates a 1:1 equal fold abundance. SYNW0160 conserved hypothetical protein; SYNW1119 6-phosphogluconate dehydrogenase; SYNW1213 thioredoxin peroxidase; SYNW1815 ABC transporter, substrate binding protein, phosphate; SYNW0406 hypothetical protein; SYNW2508 molecular chaperone DnaK2, heat shock protein hsp 70-2. See Tables 1, 2.
