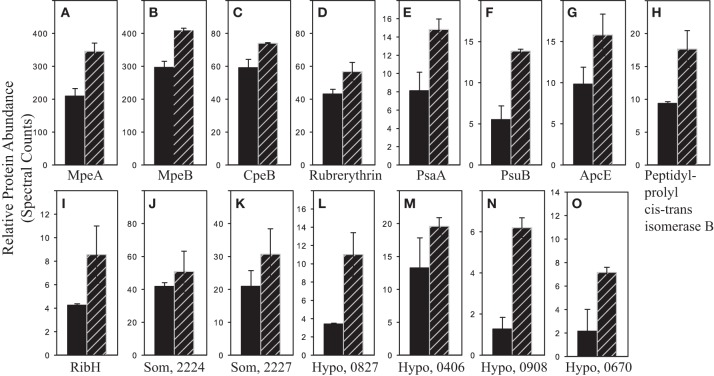
Figure 8.
Proteins more abundant with short-term cadmium addition. Relative protein abundances of proteins two-fold or more greater in abundance and/or statistically different by Fisher's Exact Test in the no Zn/65 μM PO43−/+ 4.4 pM Cd2+ (hatched bars) compared to the no Zn/65 μM PO43− treatments (solid bars). (A) SYNW2009 C-phycoerythrin class II, α chain, (B) SYNW2008 C-phycoerythrin class II, β chain, (C) SYNW2017 C-phycoerythrin class I, β chain, (D) SYNW2369 rubrerythrin, (E) SYNW2124 PSI P700 (PsaA), (F) SYNW3191 PSII extrinsic precursor (PsuB), (G) SYNW0486 anchor polypeptide LCM (ApcE), (H) SYNW1264 peptidyl-prolyl cis-trans isomerase, (I) SYNW0082 riboflavin synthase subunit b (RibH), (J) SYNW2224 possible porin (Som, 2224), (K) SYNW2227 possible porin (Som, 2227), (L) SYNW0827 hypothetical protein (Hypo, 0827), (M) SYNW0406 hypothetical protein (Hypo, 0406), (N) SYNW0908 hypothetical protein (Hypo, 0908), and (O) SYNW0670 hypothetical protein (Hypo, 0670). Error bars are the standard deviation of duplicate injections.

