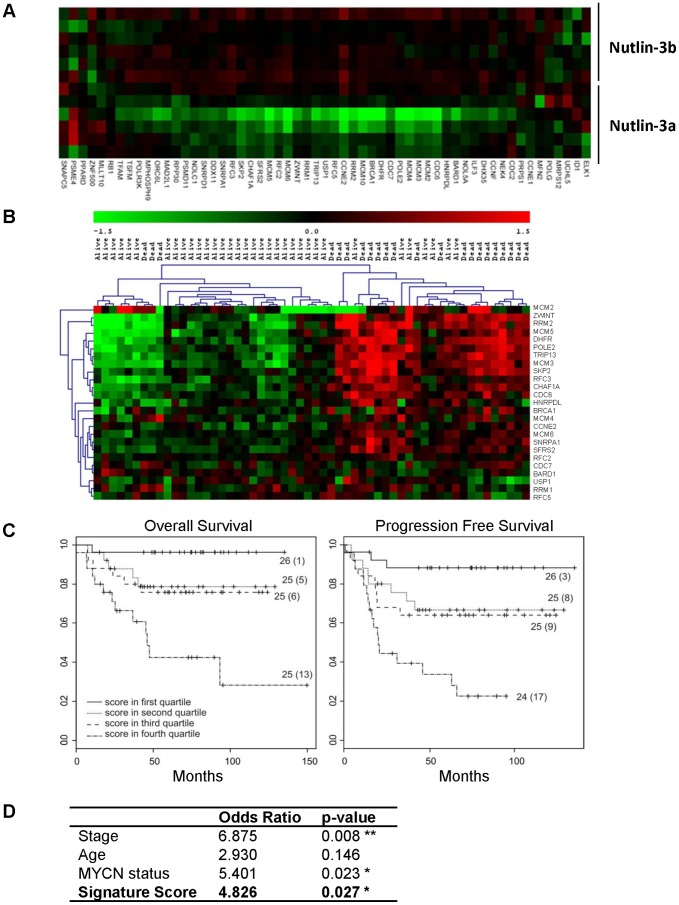
Figure 2. Correlation of p53 repressed genes and poor prognosis.
(A) Heat map of the gene set significantly down-regulated by Nutlin-3a but not Nutlin-3b. (B) Heat map with hierarchical clustering of the gene set with respect to neuroblastoma prognosis (discovery set 5). (C) Kaplan–Meier and log-rank analysis for progression-free (PFS) and overall (OS) survival of discovery set 2 based on 25 gene set: survival of 101 neuroblastoma patients in the 4 quartiles of the signature score. Numbers in parentheses refer to number of patients who experienced an event. (D) Multivariate logistic regression analysis: Odds Ratio and p-values are shown for disease stage (stage 4 vs. other), age (< or > 12 months), MYCN status (amplified vs. non-amplified), and the 25-gene signature score according to methods previously published [19].

