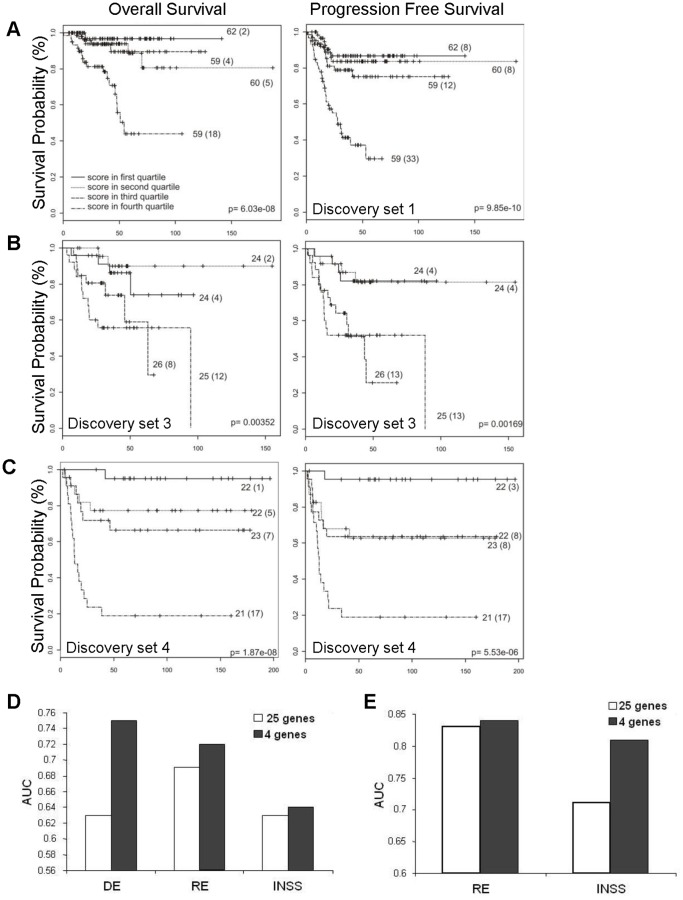
Figure 3. The four-gene signature predict neuroblastoma outcome.
Kaplan–Meier and log-rank analysis for progression-free (PFS) and overall (OS) survival in discovery set 1 (A), set 3 (B), and set 4 (C) based on the four-gene signature score. (D, E) Comparison of signature performance between all 25 and the 4 selected genes. Results from discovery and validation study strategy. (D) Gene predictors made in discovery set 4 and predictions made in discovery set 1. (E) Gene predictors made in validation set 4 and predictions made in discovery set 5. X axis indicates clinical factors: death event (DE), relapse event (RE), and INSS stage; Y axis indicates Area Under Curve (AUC).

