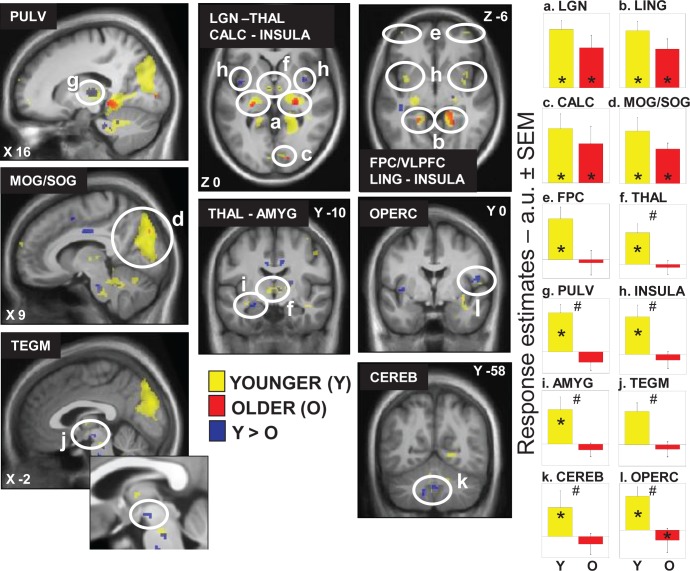
Figure 2.
Effect of the presence of light on brain responses of younger and older individuals performing an auditory two-back task. Statistical results (P < 0.001 uncorrected) overlaid over the mean structural image of all participants. Responses to light are displayed in yellow for younger individuals (Y), in red for older individuals (O), whereas group differences (Y > O) are in blue. Right panels show activity estimates (arbitrary unit – a.u. ± standard error of the mean) in each brain region. See Table 2 for names of the brain regions corresponding to the letters and abbreviations. *P < 0.05 corrected for multiple comparisons over small volumes of interest; # significant group differences P < 0.05 corrected for multiple comparisons over small volumes of interest.

