
Figure 4.
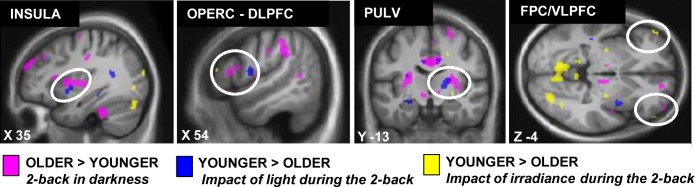
Overlay of the group differences in the brain responses to the task and in relation to light exposure. Significant group differences in the brain responses to the task are in pink (older > younger cf. Figure S2), the effect of light on brain responses is in blue (Y > O; cf. Figure 2) and the effect of changes in light irradiance is in yellow (Y > O; cf. Figure 3).