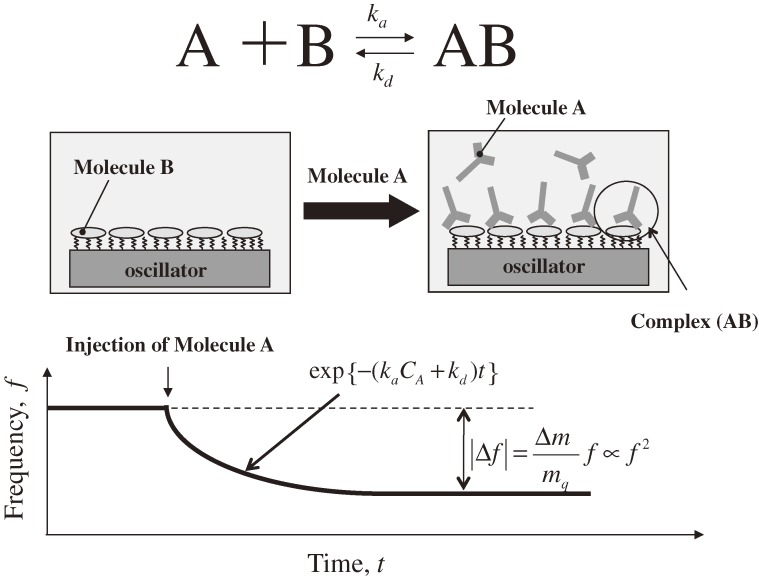
Figure 1.
Schematic of the QCM biosensor operation for monitoring a binding reaction between biomolecules A and B. ka and kd are association and dissociation velocity constants, respectively, and CA denotes the concentration of injected analyte. f and Δf are fundamental resonance frequency and frequency change, respectively. Δm and mq are adsorbed mass and mass of the quartz resonator, respectively.

