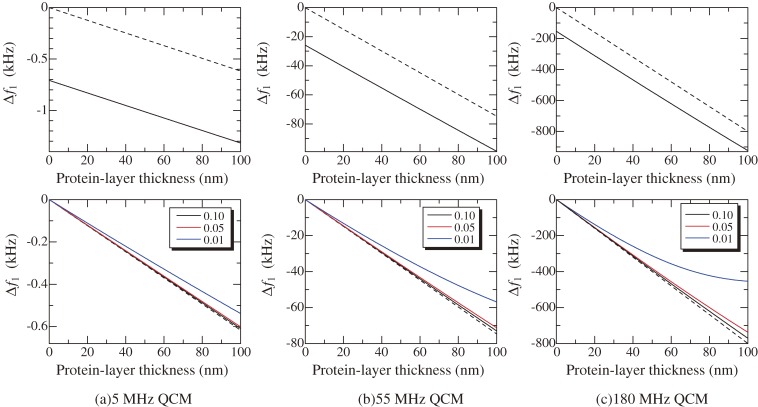
Figure 4.
Changes in the fundamental resonance frequencies for (a) 5, (b) 55, and (c) 180 MHz QCMs calculated by the three-layer viscoelastic model. Broken lines show the mass-loading effect based on the Sauerbrey equation. Used parameters are ηsol = 0.001 Pa·s, μp = 1 kPa, ρp = 1100 kg/m3, and dsol = 1 mm. Upper figures are resonance frequency changes for the three QCMs for ηp = 0.1 Pa·s, and lower figures are relative frequency changes to those without the protein layer; numbers indicate ηp values in Pa·s.

