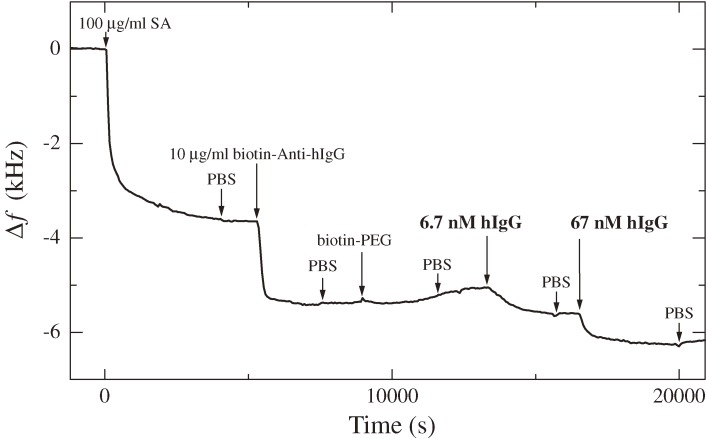
Figure 6.
A frequency change observed in a multi-injection measurement (f1 = 55 MHz). SA, hIgG, biotin-PEG, and PBS represent streptavidin, human immunoglobulin G, biotin-conjugated polyethylene glycol, and phosphate buffered saline solutions, respectively. This figure was reproduced with permission from Ogi et al.31)

