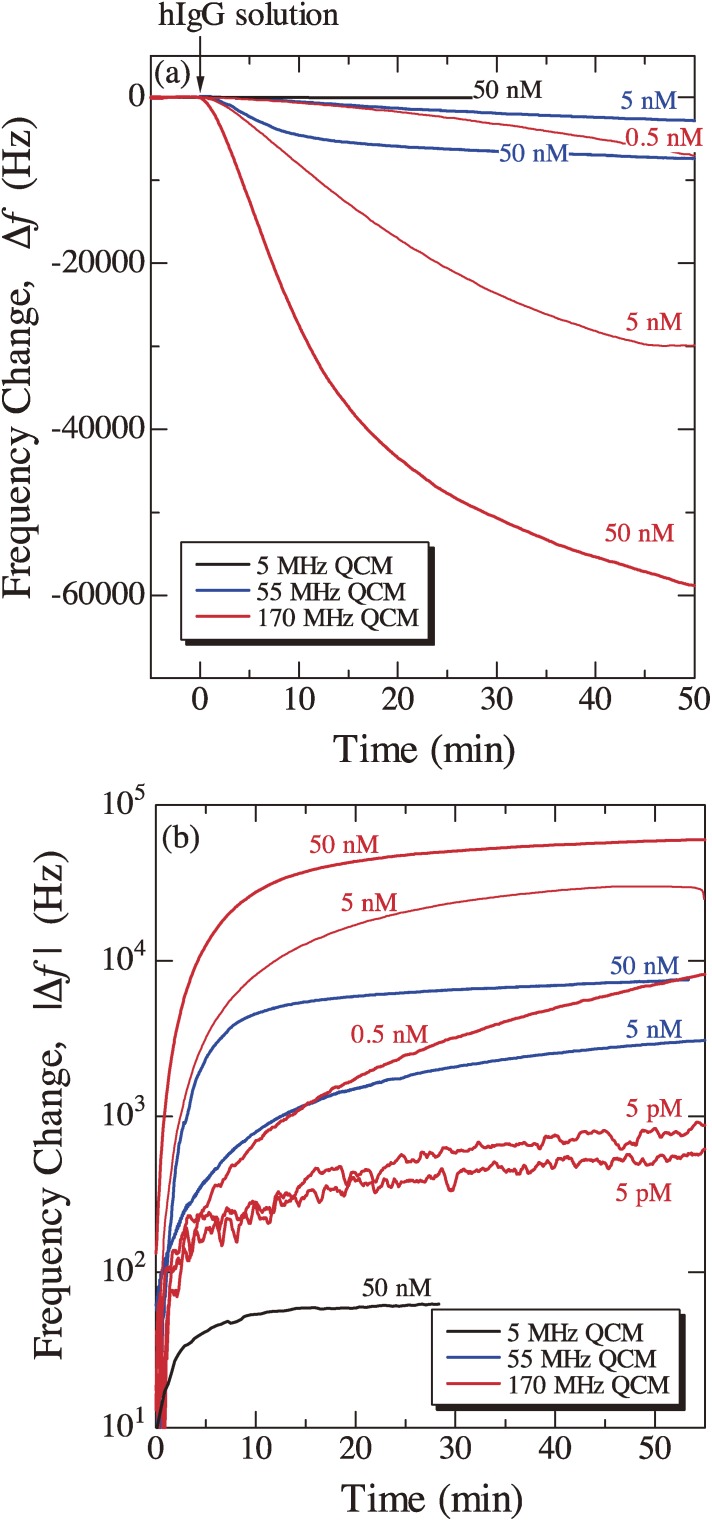
Figure 10.
(a) Typical frequency changes caused by the injection of the human immunoglobulin G (hIgG) solution detected by three electrodeless QCMs. (b) Logarithmic resonance-frequency change during the injection of the hIgG solution. For the 5 pM hIgG solution, two independent measurements are shown. These figures were reproduced with permission from Ogi et al.22)

