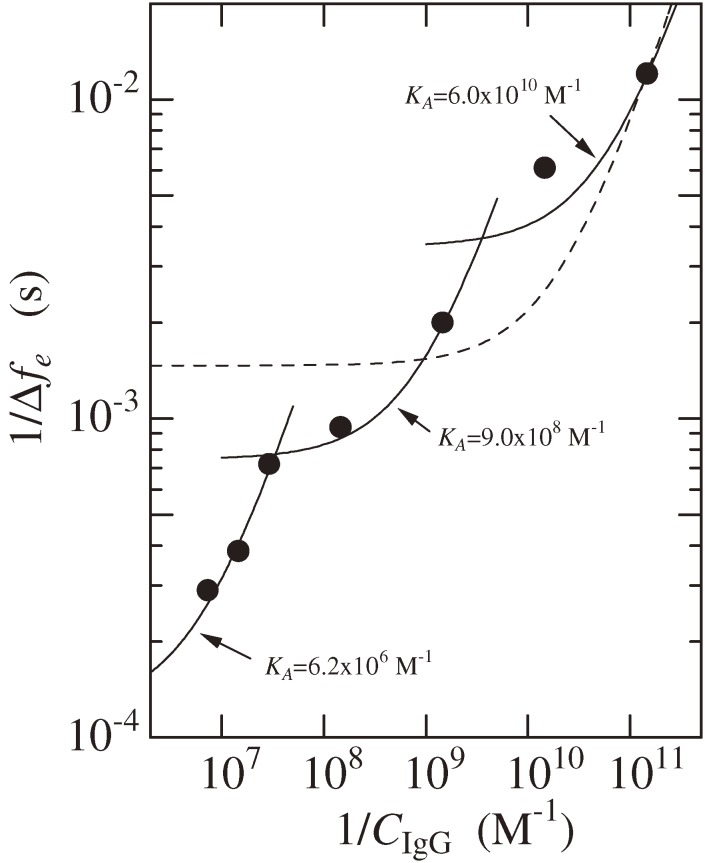
Figure 12.
Relationship between the inversed analyte concentration CIgG−1 and inversed equilibrium frequency change Δfe−1. A WE-QCM with f1 = 55 MHz was used. The broken line shows a fit of the theory to all the measurements. Solid lines are fitted theory to the three data points. This figure was reproduced with permission from Ogi et al.36)

