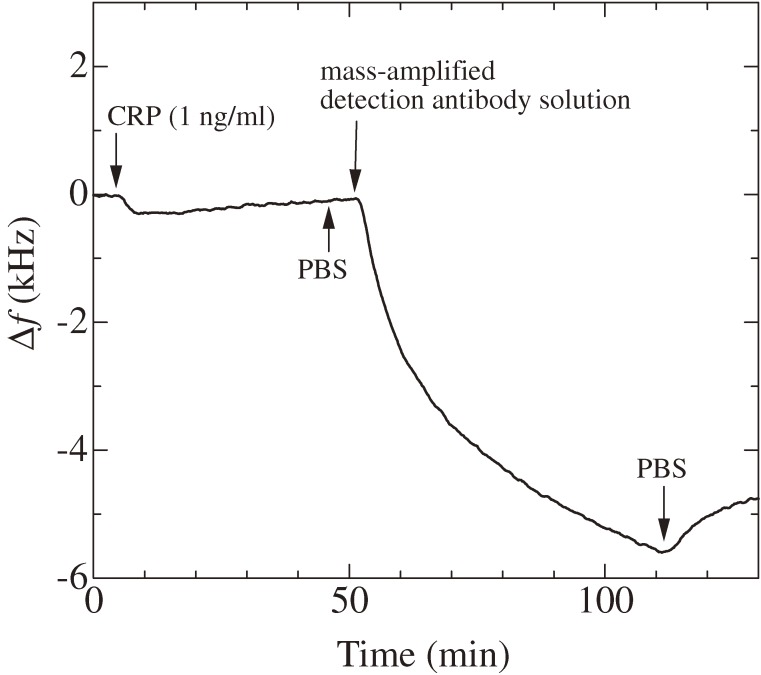
Figure 23.
Frequency response for injections of a 1 ng/ml C reactive protein (CRP), PBS, and the mass-amplified detection-antibody solutions (f1 = 180 MHz). Arrows indicate arrival times of solutions at the sensor cell. This figure was reproduced with permission from Ogi et al.30)

