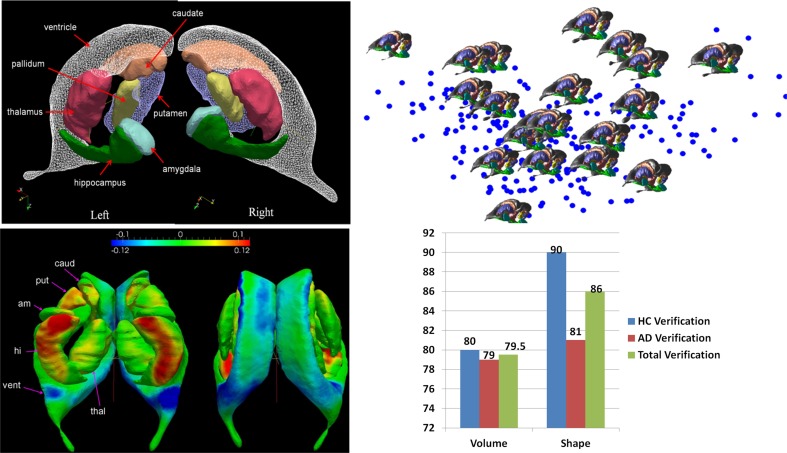
Figure 5.
Top row: Panel shows the left-right subcortical structures for human at 1 mm including amygdala (A, light blue), caudate (C), hippocampus (H, green), globus pallidus (PAL), putamen (PUT), ventricle (VL), thalamus (TH). The right panels shows the layout in the geodesic coordinate system of 250 of the anatomies (blue dots) in the first two dimensions with 20 of the brains shown explicitly with the basis dimensions on the order of 20–40 dimensions for each subcortical structure occupying 95% of the variatiance of anatomical variation with ordering A20<PAL22<C25<PUT27,VL27<H30<THA40. Bottom row: Shows the geodesic coordinates of the population (top right) relative to the atlas (top left) shown as a shape statistic computed by averaging over all geodesic mappings and computing the Jacobian of the tangent vector at the identity representing the anatomy. Bottom left shows the difference in the means μHC − μAD superimposed on the template. The log-determinant of the Jacobian is shown, with red corresponding to shrinking and blue expansion. The bottom left panel depicts the hippocampus and amygdala are significantly red means large shrinkage relative to the contols, with the blue signaling the expansion of the ventricles. Bottom right panel shows a classifier based on three structures using only volume (left hand) and all the 20–40 dimensions of the anatomical phenotype encoded by the geodesic coordinates for hippocampus, amygdala, and ventricle. The images used for this analysis are a portion of a dataset published with the methodological detail (Tang et al., 2013a).

