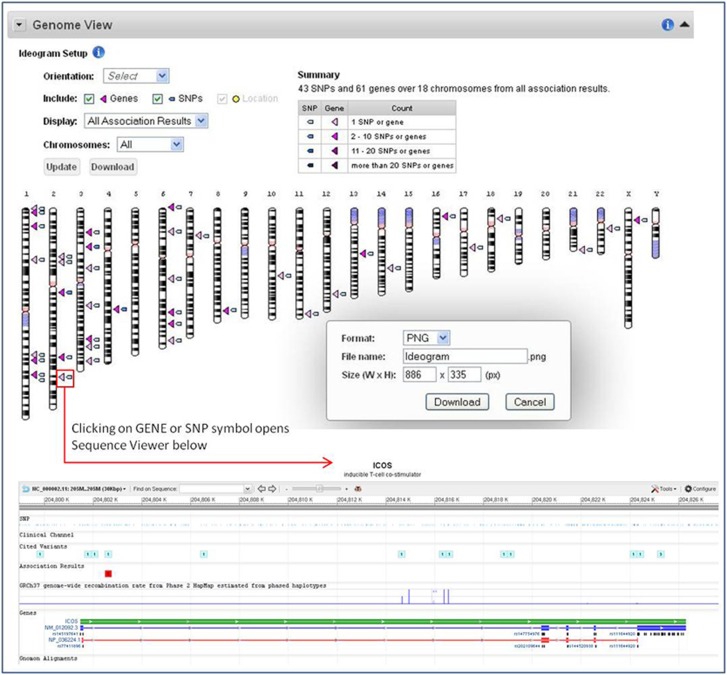
Figure 2.
PheGenI genome view and sequence viewer. PheGenI association results displayed on a customizable and downloadable ideogram. In this example, 43 SNPs (blue triangles) and 61 genes (pink triangles) across 18 chromosomes were identified as associated with celiac disease (P-value threshold set at 1 × 10⁻⁸). Clicking on the SNP or GENE triangle opens up a customizable sequence viewer to further explore a particular genomic region.

