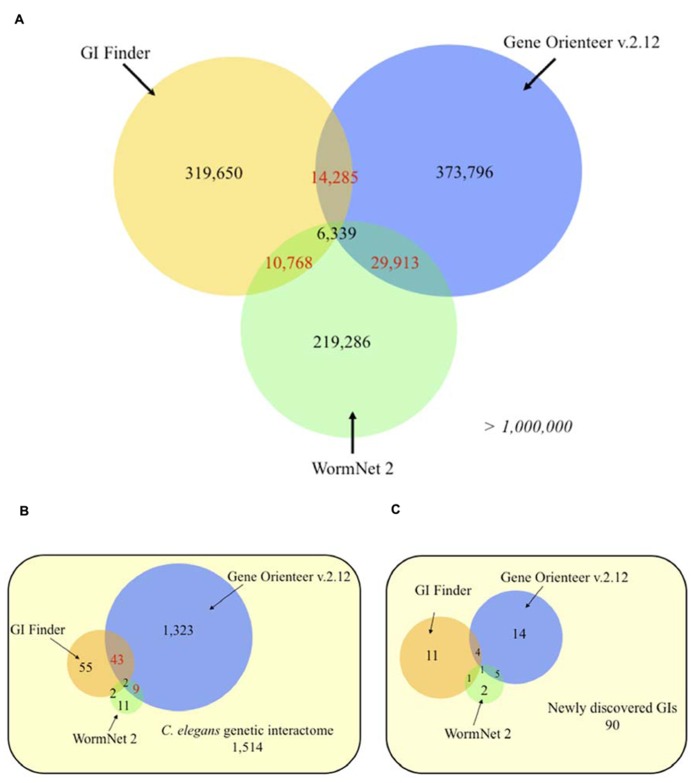
FIGURE 4.
Venn diagrams of C. elegans predicted genetic interactions from three different approaches. (A) Genome-wide predictions. (B) Experimentally validated genetic interactions taken from Lee et al. (2010a). (C) Experimentally validated genetic interactions (GIs) collected from recent studies (2009–2012). Numbers in red indicates statistically significant overlaps (P < 0.05), evaluated using an exact hypergeometric probability test. The selected score thresholds used to predict GIs yield the same false positive rate (FPR) for all three predictors. Each FPR was evaluated using a negative set consisting of 10,000 random gene pairs free of any gene present in validated interactions. Predicted GIs or functional links, for GeneOrienteer and WormNet respectively, were downloaded in October 2010.

