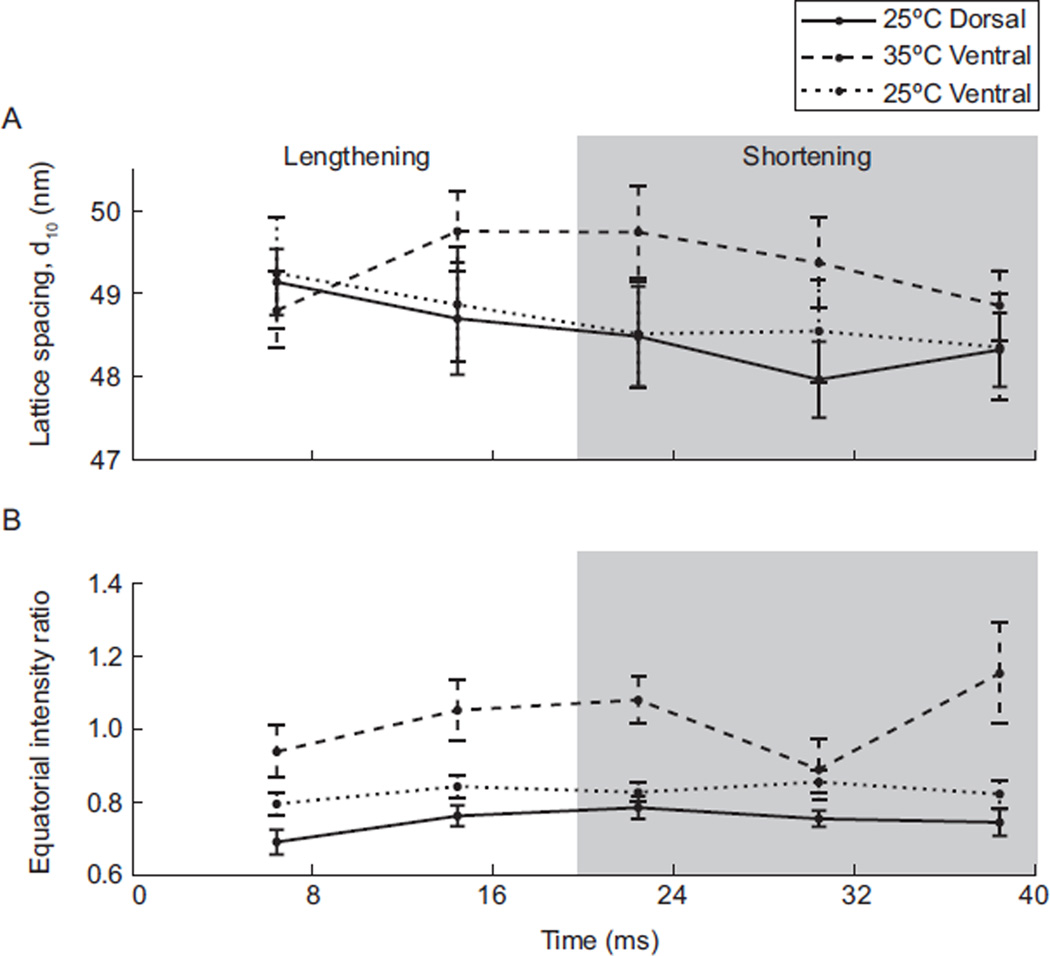
Fig. 2.
Variation in lattice structure throughout the contraction cycle (mean ± SEM; n=5 moths). (A) Lattice spacing, determined by d10, plotted as a function of contraction cycle for dorsal muscle at 25°C and ventral muscle at 35°C and 25°C. Across the 5 time points mean lattice spacing was significantly lower in 25°C muscle than in 35°C muscle, regardless of location and time point in the contraction cycle. (B) Equatorial intensity ratio as a function of contraction cycle. Muscle at 35°C showed the expected cyclic response in intensity ratio. In contrast, muscle at 25°C showed a stable intensity ratio. The similar response of both locations at 25°C supports that dorsal muscle’s contractile dynamics are not specialized to operate at lower temperatures.

