Figure 4.
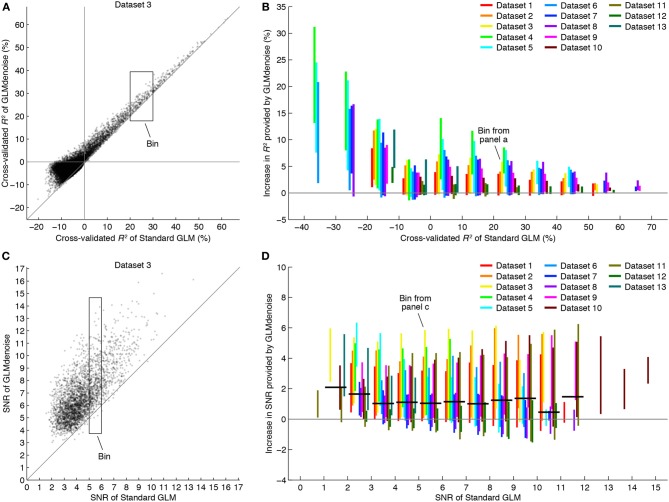
GLMdenoise improves accuracy and reliability of BOLD response estimates. Using the DNB, we compared the accuracy and reliability of GLMdenoise to that of an analysis involving no noise regressors (termed Standard GLM). (A) Comparison of R2 for an example dataset. Each dot indicates cross-validated R2 values for an individual voxel. (B) Summary of changes in R2. Voxels are binned according to the cross-validated R2 of Standard GLM (bin size 10%). For each bin with at least five voxels, we compute the increase in R2 provided by GLMdenoise and plot a line indicating the 95% range of results. GLMdenoise provides more accurate BOLD response estimates for nearly all voxels. (C) Comparison of SNR for an example dataset. Format same as (A), except that only voxels passing a minimum threshold are shown (voxels with cross-validated R2 greater than 0% for either model). (D) Summary of changes in SNR. Format same as (B), except that voxels are binned according to SNR (bin size 1). For each bin, we compute the median increase in SNR for each dataset and then the median of these values across datasets. The results are shown as thick black lines (for bins with contributions from at least two datasets). On average, GLMdenoise provides more reliable BOLD response estimates than Standard GLM.

