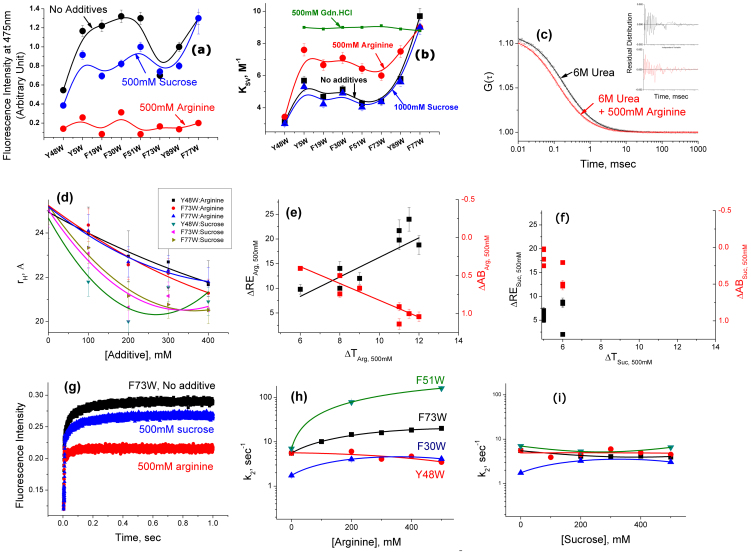
Figure 4.
(a) The extent of ANS binding in the absence (black) and presence of 500 mM arginine (red) and 1 M sucrose (blue). The extent of ANS binding has been determined by measuring the steady state fluorescence emission intensity at 475 nm. An ANS solution of the same buffer (in the absence and presence of sucrose or arginine of the same concentration) has been used as a background whose contribution has been subtracted at each data point. (b) The variation of KSV values for different KMP-11 mutants in the absence (black) and presence of 500 mM arginine (red), 1 M sucrose (blue), and 500 mM gdn.HCl (green). (c–d) FCS data: The representative correlation functions (c) obtained with the FCS experiments using the urea unfolded F77W/F9C mutant in the absence (black) and presence of 500 mM arginine (red). The fits of the data assuming a simple diffusion of the protein with the diffusion time of τD are shown by the residual distribution analyses (black and red in the absence and presence of arginine respectively, inset); (d) The variations of hydrodynamic radii (rH) of different unfolded mutants induced by increasing concentrations of arginine and sucrose; (e–f) Correlations between the thermal stability, ANS binding and Refolding efficiency: The variation in ΔRES,C (black) and ΔABS,C (red) with ΔTS,C in presence of 500 mM of (e) arginine and (f) sucrose. Both figures are plotted with the same scale for the ease of comparison. (g–i) Refolding kinetics data of the KMP11 mutants: (g) The refolding kinetics trace in the absence of any additive (black trace) could be fit to a sum of two exponentials. The nature of kinetics did not change in the presence of 500 mM sucrose (blue trace). The addition of 500 mM arginine simplifies the refolding kinetics removing the second slow component (red trace); (h) For the partially folded mutants (shown are F73W, F51W, and F30W), the values of k2 increased with the increase in the concentration of arginine, while the native like mutant (Y48W) showed no significant increase; (i) The addition of sucrose did not show any significant change in the values of k2. The error bars were calculated using three independent measurements.

