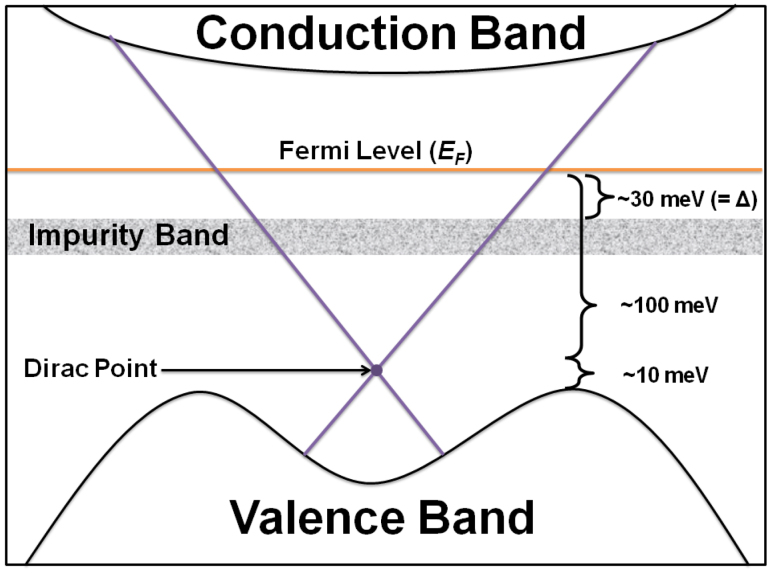
Figure 5. Schematic of band diagram of BSTS, with the (donor) impurity band lying just below the Fermi level.
The relative positions of the valence band, Dirac point, Fermi level and conduction band were taken from Ref. 15 for a Bi1.5Sb0.5Te1.7Se1.3 sample. Δ = activation gap.

