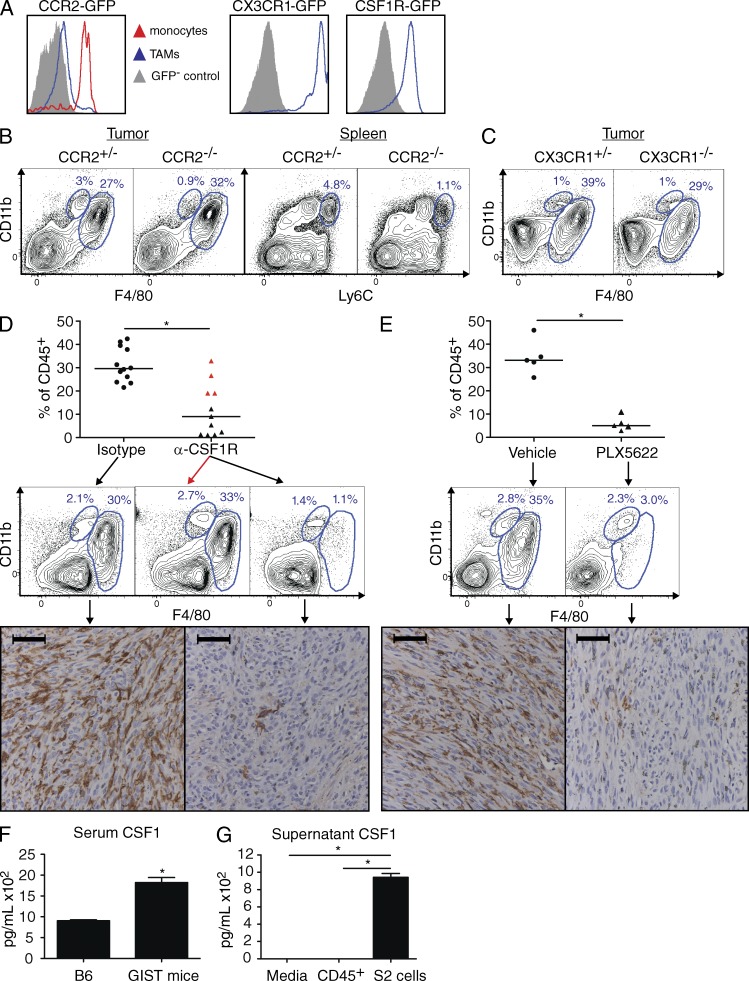
Figure 2.
TAMs require CSF1R, but not CCR2 or CX3CR1. (A) GIST mice were crossed to CCR2-, CX3CR1-, and CSF1R-GFP reporter mice and TAMs were analyzed from 6–8-wk-old animals. (B and C) Tumors and spleens from CCR2−/−-GIST mice (B) and tumors from CX3CR1−/−-GIST mice (C) were analyzed. Monocytes are indicated as CD11bhiF4/80int or CD11bhiLy6Chi. Plots shown for each reporter mouse are representative of two experiments with one to three mice per group. (D and E) After 4 wk of treatment with α-CSF1R (D) or PLX5622 (E), tumors from GIST mice were analyzed and TAMs as a percentage of CD45+ cells were determined. Bars represent medians. (D, top and middle) Composite of two similar experiments (total n = 11–12 mice per group). Red triangles in the α-CSF1R treatment group indicate mice depleted <50% of the median of isotype-treated controls. Representative flow plots show control (left), nondepleted (middle, red arrow), and depleted (right) animals. (E, top and middle) One of two similar experiments (n = 5 mice per group). (D and E, bottom) Representative F4/80 immunohistochemistry is shown below matched groups. Bars, 50 µM. (F) Serum CSF1 in age-matched B6 mice (n = 2) or GIST mice (n = 4) measured by ELISA. (G) 5 × 10⁴ freshly isolated CD45+ leukocytes from a spontaneous tumor in a GIST mouse or S2 cells were cultured for 48 h and supernatant CSF1 was measured by ELISA. Experiments show in F and G were performed once, with individual mice serving as replicates for F and triplicate wells for G. Bar graphs show mean ± SEM. *, P < 0.05.

