Figure 2.
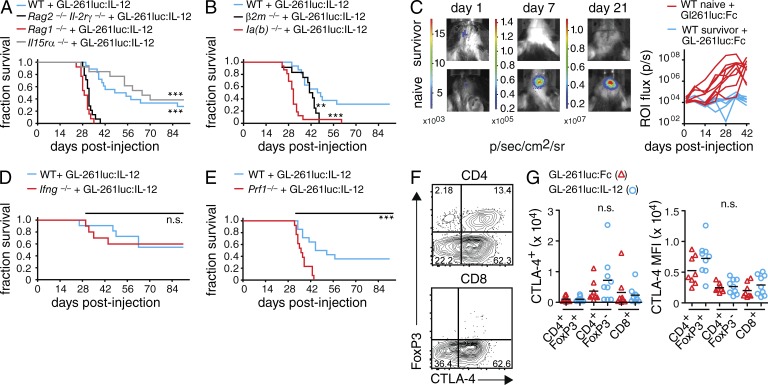
T cell dependency of IL-12–mediated glioma rejection. (A, B and D, E) GL-261luc:IL-12 cells were implanted i.c. into various immunodeficient mouse strains. Animals were monitored for up to 91 d; Log-Rank test; *, P < 0.05; **, P < 0.01; ***, P < 0.001. (A) Survival of WT, Rag2−/−Il2rg−/−, Rag1−/−, and Il15ra−/− mice (n ≥ 13/group); p(Rag2−/−Il2rg−/− vs. WT), p(Rag1−/− vs. WT), p(Rag2−/−Il2rg−/− vs. Il15ra−/−) and p(Rag1−/− vs. Il15ra−/−) < 0.0001. (B) Survival of WT, β2m−/− and Ia(b)−/− mice (n ≥ 12/group); p(β2m−/− vs. WT) = 0.0052, p(Ia(b)−/− vs. WT) < 0.0001. (C) Rechallenge of naive WT animals and survivors (that had been previously challenged with GL-261luc:IL-12 in the contralateral hemisphere) with GL-261luc:Fc cells; (left) representative BLI at days 1, 7, and 21; (right) BLI quantification (n ≥ 7/group). (D) Survival of WT and Ifng−/− mice (n ≥ 10/group) injected with GL-261luc:IL-12 (E) Survival of WT and Prf1−/− mice (n ≥ 13/group); p(Prf1−/− vs. WT) = 0.0005. (F and G) WT mice were implanted i.c. with GL-261luc:Fc or GL-261luc:IL-12 and analyzed for TILs at day 21 using flow cytometry. (F) Representative contour plot (GL-261luc:Fc TILs gated on live CD45hi/CD11b−/NK1.1− cells). (G) Number (left) of CTLA-4 positive cells and CTLA-4 mean fluorescent intensity (MFI, right) for live CD4+FoxP3+, CD4+FoxP3−, or CD8+ T cells (n ≥ 8/group). One-way ANOVA with Bonferroni post-test; pooled data from two to three independent experiments each; *, P < 0.05; **, P < 0.01; ***, P < 0.001.

