
Figure 1.
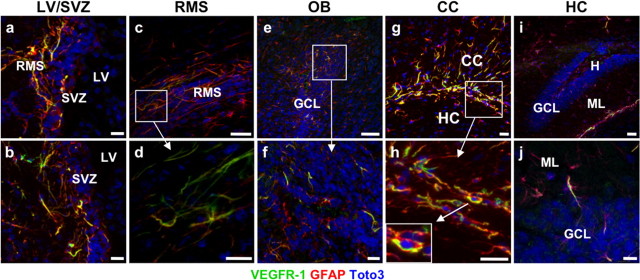
Expression of VEGFR-1 in neurogenic areas of the adult mouse brain. a–j, Sagittal sections of the brain showing VEGFR-1 expression (green) in GFAP+ cells (red), counterstained with DAPI (blue) in different brain areas. a, b, SVZ of the LV. c, Section of adult mouse RMS showing expression of VEGFR-1 (green) throughout the stream in GFAP+ cells. d, Higher magnification of c. e, f, In the adult mouse OB, expression of VEGFR-1 (green) was detected in GFAP+ cells mainly in GCL. f, Higher magnification of e. g, h, Many GFAP+ cells (red) cells in CC coexpress VEGFR-1 (green). h, Higher magnification of g. Inset in g shows an example of clear expression of VEGFR-1 (green) and GFAP (red) in the same cell, nucleus (DAPI, blue). i, j, sections of adult mouse HC with scattered GFAP+ cells (red) expressing VEGFR-1 (green). Scale bars: a, b, f, g, h, j, 20 μm; c, d, e, i, 50 μm. H, Hilus; ML, Molecular layer.