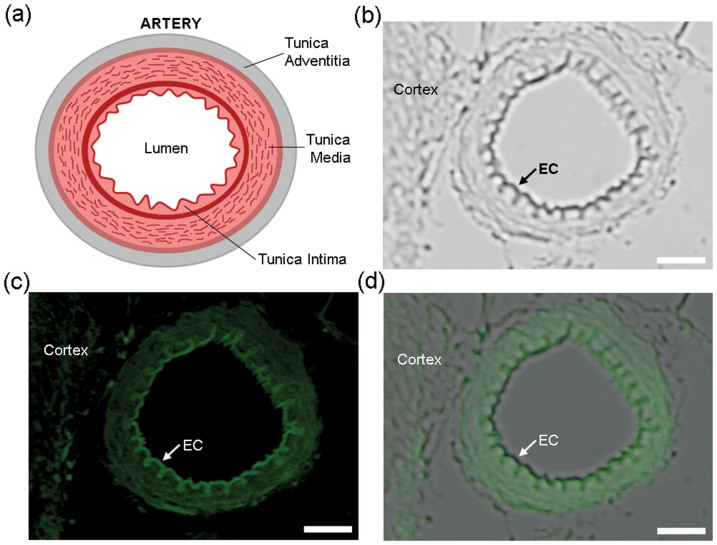
Figure 6. Labeling thiols on brain tissue.
(a) Cartoon illustration of the structure of a typical artery. (b) DIC image of a tissue slice from a rat brain after incubation with TCEP (14 mM) for 10 min, Mal-Cys (16 mM) for 30 min, and TCEP(7 mM) with CBT-GGG-FITC (50 μM) for 2 h at RT. Left part: cerebral cortex. Right: small cerebral artery. Arrow indicates the innermost layer (single layer of endothelial cell) of the small artery. (c) Fluorescence image of the tissue slice in b. Arrow indicates that the single layer of endothelial cell has the brightest fluorescence emission among the tissues of the small artery. (d) Overlay of images in b and c. Scale bar: 10 μm.

