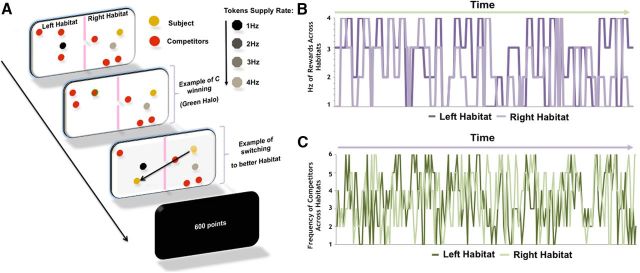
Figure 1.
Schematic of the continuous-input foraging task and plots depicting R and C changes over time. A, B, Plots depict frequency in hertz of R (A), which were presented in 8 s blocks, and C (B) across both habitats over time. Schedules were chosen such that R and C were decorrelated across habitats. C, The task involved the subject trying to acquire as many tokens as possible by switching between habitats to increase the likelihood of acquiring the tokens and by pressing a button as fast as possible when a token appeared. Subjects, told that speed of response was a factor in determining which competitor won the token, were encouraged to press a response button as quickly as possible after a token appeared in their habitat. Competitors were unknown to each other and had approximately the same competitive abilities.

