
Figure 1.
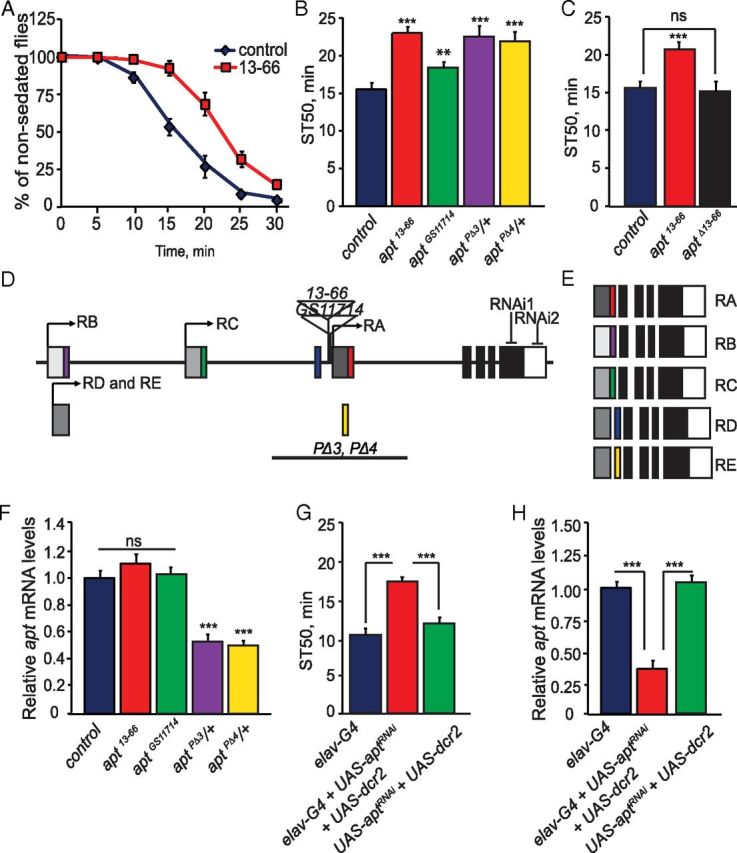
apt mutants display reduced ethanol sedation sensitivity. A, Control (wB) and apt13–66 flies were exposed to a sedating dose of ethanol (73% ethanol vapor) for 30 min. The number of sedated flies was measured over the course of the exposure. B, Quantification of ethanol sedation sensitivity in different apt mutant strains. The time at which 50% of the flies were sedated, the mean sedation time (ST50), was calculated by linear interpolation. ST50 values of apt mutant strains differed significantly from control (wB) flies (one-way ANOVA, Tukey–Kramer post hoc, n = 16). C, Precise excision of the P-element in apt13–66 flies (aptΔ13–66) completely reverted the ethanol sedation sensitivity phenotype. (Student's t test, n = 12) D, E, Schematic of the apt gene. The apt gene is predicted to encode for five alternative transcripts, producing five distinct protein isoforms. Transcription start sites for each of the transcripts are indicated by arrows; the same transcription start site is used for both the apt-RD and apt-RE transcripts. Translated regions are indicated in colors and black, while untranslated regions are in shades of gray. Locations of the P-element insertions in apt13–66 and aptGS11714 mutant flies are indicated; both insertions are upstream of the apt-RA transcript. Locations of the inverted-repeat sequences used to generate RNAi knockdown of apt and the location of sequences deleted in the aptPΔ3 and aptPΔ4 mutant flies are also shown. F, Expression of apt in control flies (wB) and apt13–66, aptGS11714, aptPΔ3/+, and aptPΔ4/+ mutant flies as quantified by qPCR. No difference in apt expression was observed between control (wB) and apt13–66 and aptGS11714 mutant flies, while decreased apt expression to that of 50 and 55% was observed in aptPΔ3/+ and aptPΔ4/+ mutant flies, respectively. (Student's t test, n = 3). G, RNAi knockdown of apt specifically in neurons reduces ethanol sedation sensitivity. ST50 values of flies coexpressing dcr2 and aptRNAi using pan-neuronal driver elavC155-GAL4 (elavC155-GAL4;UAS-dcr2/+;UAS-aptRNAi/+) differs significantly from the GAL4 (elavC155-GAL4) and UAS (UAS-dcr2/+;UAS-aptRNAi/+) control flies (one-way ANOVA, Tukey–Kramer post hoc, n = 16). H, apt expression upon RNAi knockdown. Pan-neuronal expression of aptRNAi (elavC155-GAL4;UAS-dcr2/+;UAS-aptRNAi/+) reduces apt expression by 65% compared with the GAL4 (elavC155-GAL4) and UAS (UAS-dcr2/+;UAS-aptRNAi/+) controls. One-way ANOVA, Tukey–Kramer post hoc, n = 3). For this figure and all other figures, error bars indicate SEM and p values are ***p < 0.0001, **p < 0.001, and *p < 0.01.