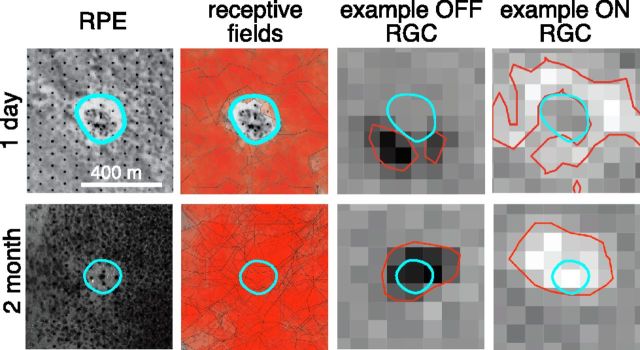
Figure 2.
Restoration of retinal function after photocoagulation. Shown are 200 μm lesions at 1 d (upper row) and 2 months (lower row) after the procedure. The first column on the left shows photographs of the retina on the multielectrode array taken after the recording. The regularly spaced black dots are electrodes and the grayish background shows RPE cells. The abnormal RPE zone is outlined by the cyan contour and indicates the lesion location. The second column from the left shows the photographs overlaid with the receptive fields of the recorded RGCs. The receptive field of each RGC is represented by an isosensitivity contour uniformly filled with semitransparent red color. The third and fourth columns from the left show spatial sensitivity profiles of example OFF and ON RGCs, as revealed through their STA response to the spatiotemporal white noise. The abnormal RPE zone (cyan contour) and the isosensitivity contours (red) are shown.

