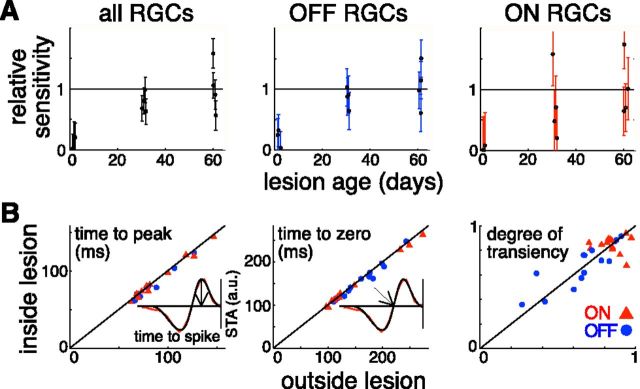
Figure 3.
Restoration of retinal sensitivity and response kinetics in 200 μm lesions. A, Change in sensitivity over the lesion site with time. Sensitivity was calculated as a sum of STAs of all the RGCs recorded in a preparation. This sum within a lesion site was normalized to the average sensitivity over the healthy part of the retina. The uncertainties were estimated from the variability of the sensitivity over the healthy retinal regions. Plots for all RGCs and OFF- and ON-center RGCs are shown. Each point represents a separate lesion. Data from five retinal preparations are shown. B, Comparison of response kinetics between the inside and outside of the lesion portions of receptive fields of individual RGCs. Three aspects of the kinetics are shown: time to the first peak of the time course, time to the first zero crossing of the time course, and the degree of transiency measured through the relative areas of the first and second lobes of the time course. Inserts with a time course illustrate how the first two were measured. The red line in the example time course corresponds to the measured STA data and the smooth black line to the fit to that data. a.u. indicates arbitrary units. The plots include 27 cells that have receptive fields partially overlapping 4 2-month-old lesions in 2 retinal preparations. OFF-center RGCs are shown with blue circles; ON-center RGCs are shown with red triangles.

