Figure 6.
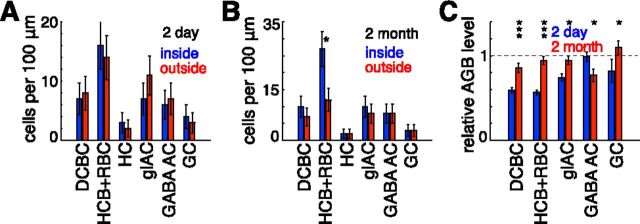
Presence of the neuronal cell types within acute and healed lesion sites. A, Number of cells per 100 μm length in 2-d-old lesion section shown in Figure 5A. Cell counts for the following six neuronal cell types are shown: depolarizing cone bipolar cells (DCBC), hyperpolarizing cone bipolar cells and rod bipolar cells (HCB+RBC), horizontal cells (HC), glycinergic amacrine cells (glAC), GABAergic amacrine cells (GABA AC), and ganglion cells (GC). For each of these cell types, blue (left) and red (right) bars show cell numbers inside and outside the lesioned area, respectively. B, Number of cells per 100 μm length in the 2-month-old lesion section shown in Figure 5B. Abbreviations and color (order) scheme are the same as in A. C, AGB levels for different cell types inside the lesions in the sections shown in Figure 5. Blue (left) and red (right) bars correspond to the AGB levels in the 2-d-old and 2-month-old lesions, respectively. For each cell type, the average AGB level among the cells within the lesion was normalized by the average AGB level calculated over the cells of the same type located outside the lesion in the same section. In all plots, *p < 0.05, **p < 0.01, and ***p < 0.001. Error bars correspond to counting uncertainties (n1/2) for A and B and SEM for C.

