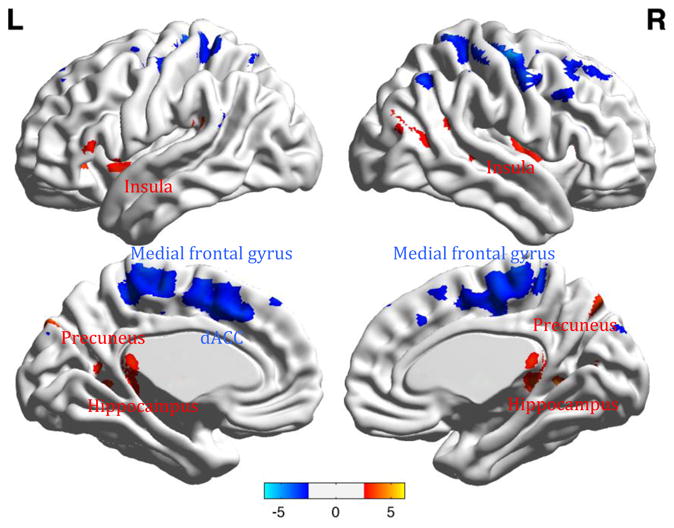
Fig 3.

Group analysis of resting state functional connectivity between elderly depressed participants before [N=47] and after treatment [N=21].
Legend. Red: Pre-treatment>Post treatment contrast (precuneus, insula, hippocampus). Blue: Post-treatment>Pre-treatment contrast (medial frontal gyrus, dorsal Anterior Cingulate Cortex = ACC). Color bars list the range of t-values.
