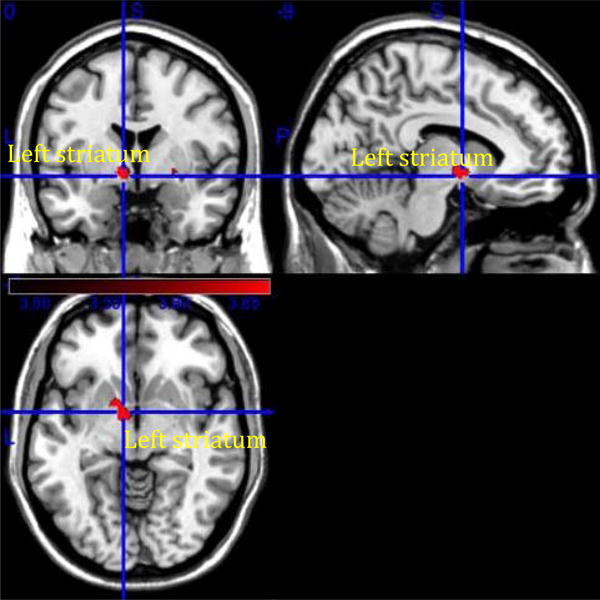
Fig 5.

Treatment effect analysis using the difference between the 12-week scan and the baseline scan (T2-T1) as outcome variable.
Non-responders [N=11] > Responders [N=10] [left striatum].

Treatment effect analysis using the difference between the 12-week scan and the baseline scan (T2-T1) as outcome variable.
Non-responders [N=11] > Responders [N=10] [left striatum].