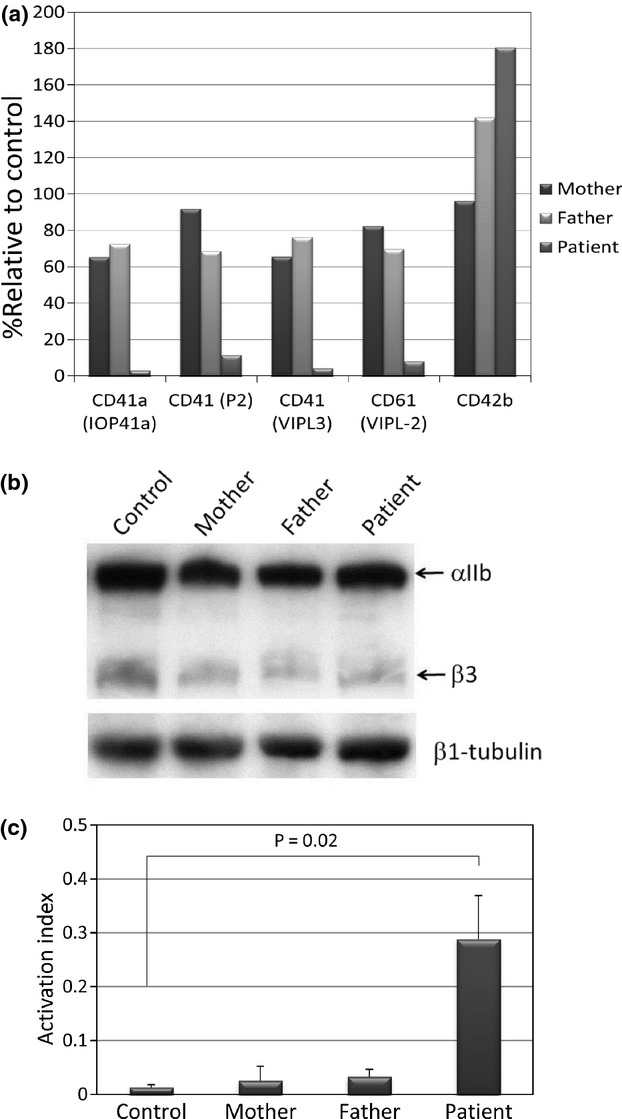
Figure 2.

Expression of αIIbβ3 in case 1 family members. (a) Surface expression of αIIbβ3 and CD42b was evaluated by binding of indicated monoclonal antibodies in flow cytometry. Percent relative binding against normal control was demonstrated. Shown are representative results of three independent experiments. (b) Total expression of αIIbβ3 was evaluated by Western blotting using rabbit polyclonal anti-αIIbβ3 antibodies. Protein loading of each well was assessed by monoclonal anti-β1-tubulin antibody (Sigma). Shown are representative results of three independent experiments. (c) Activation index of αIIbβ3. Relative PAC1 binding in the resting platelets compared with maximal PAC1 binding in the platelets stimulated with PMA is defined as activation index. Shown are means and standard deviations of three independent experiments.
