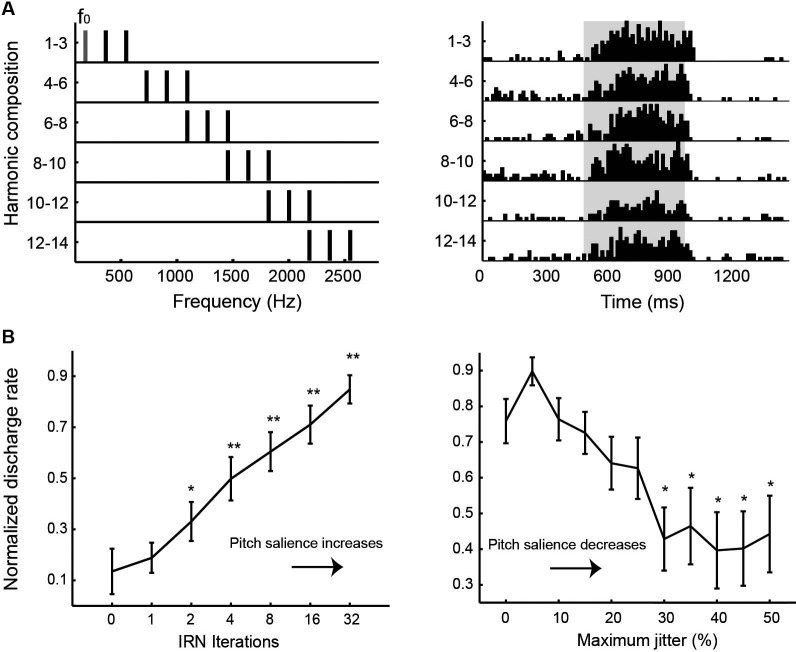
Figure 4.
Examples of pitch-selective responses recorded in marmoset auditory cortex (adapted from Bendor and Wang, 2005). (A) Left: Frequency spectra of a series of harmonic complex stimuli. The fundamental frequency component (f0) and its higher harmonics have equal amplitudes of 50 dB SPL. Right: Peristimulus time histograms of a pitch-selective neuron’s responses to the harmonic complex stimuli. Stimuli were presented from 500 to 1000 ms (indicated by the shaded region on the plot). (B) Responses of pitch-selective neurons increases with increasing pitch salience. Left: Averaged population response of pitch-selective neurons as a function of the iterations of iterated rippled noise (IRN) stimuli. The response to IRN stimuli with zero iterations is used as a reference for statistical comparison at other iterations (* p < 0.05, ** p < 0.01). Right: Averaged population response of pitch-selective neurons to irregular click trains as a function of maximum jitter. The response to a regular click train is used as a reference for statistical comparison at other jitter values (* p < 0.05).

