
Figure 10.
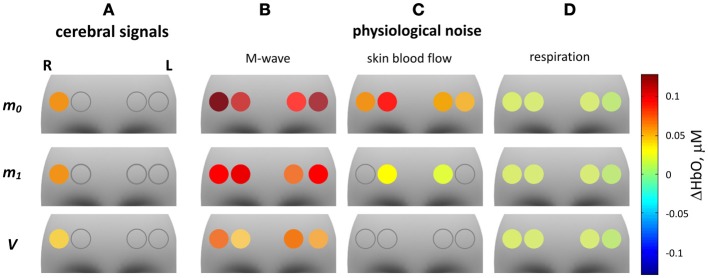
fNIRS GLM group analysis of ΔHbO signals. The 12 gray shaded areas indicate the forehead region. Circles indicate the positions of the four fNIRS channels. The color of the circles represents the mean of significant HbO concentration changes related to one of the four regressors in the GLM model. An empty circle indicates non-significance of the corresponding parameter. From left to right the four columns represent: HbO concentration changes related to cerebral activation and to physiological noise: (A) cerebral activation, (B) Mayer waves, (C) skin blood flow, (D) respiration. The three rows (from top to bottom) correspond to: ΔHbO based on m0, m1, and V.