
Figure 5.
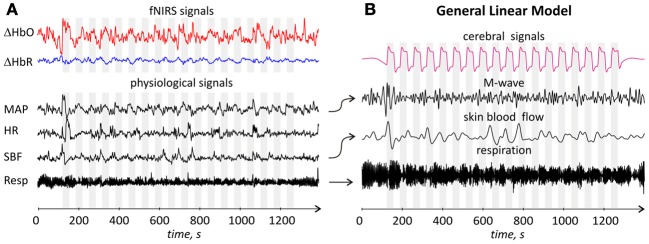
(A) Time traces of fNIRS and physiological signals for one representative subject. From top to bottom: single channel (channel 1) m0-based ΔHbO and ΔHbR, MAP, HR, SBF, and respiration signals. All signals are arbitrary scaled. Gray areas correspond to the durations of the stimulation blocks; (B) Time traces of regressors used in de-noising GLM analysis. From top to bottom: cerebral regressor, M-wave regressor obtained by filtering and time shifting of the MAP time trace, skin blood flow and respiratory regressors obtained by appropriate filtering and time shifting of skin blood flow and respiration traces, respectively. The arrows between (A,B) parts indicate which signals were used to generate the corresponding regressor.