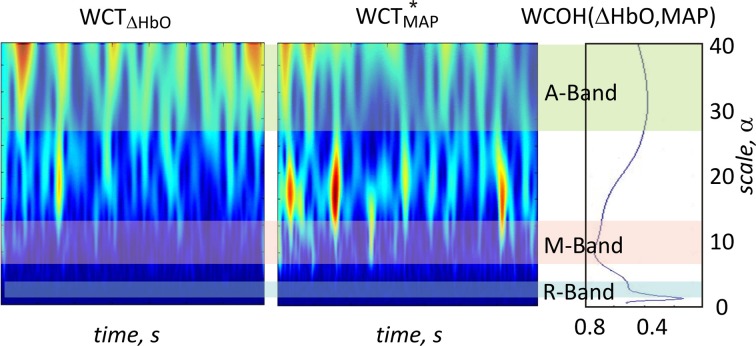
Figure 6.
Example of magnitude 2D wavelet scalograms (left ΔHbO signal, middle MAP signal) and magnitude of the wavelet coherence between ΔHbO and MAP (right) for one representative subject. Sign *indicates complex conjugation. Light blue, light red and light green bars indicate the following three scale ranges: R-band (around 3 s, 0.3 Hz), M-band (around 10 s, 0.1 Hz) and A-band (around 35 s, 0.029 Hz), respectively. The peaks in wavelet coherence are observed in R- and M-bands for this subject.

